Goal
- Do all bug fixes (map, daily and hourly forecasts, fishing index variables…)
- Be able to interact with every feature in the app (no placement hard-coded features)
Workflow
This week, I focused on bug fixes throughout the app. Some features in the app were hard-coded for appearance only. For example, the search bar for finding lakes was just a visual placeholder until I had Claude activate the feature. Although this may not have been the most significant developmental progress I’ve made on FishCast, it was necessary.
I want to expand the app to cover a larger area and adjust the fishing index accordingly, but I wanted to get the app into a presentable state before moving on. Quite frankly, the bugs in the app had become bothersome. Therefore, I decided to spend my time fixing those issues and making sure the app was working the way it was supposed to.
Over the course of the week, the small tasks I was able to accomplish included the following:
- The search engine for Michigan lakes suggests lakes and opens stations.
- Recent lakes are displaying correctly.
- Lake station pages load more quickly.
- Hourly and daily forecasts update correctly.
- Each fishing index variable updates correctly, including the charts.
- Maps load more efficiently.
The app still might not be perfect, but it has come a long way since Claude Design generated the layout. I now feel more confident expanding the app now that those preventative hard-coded features have been removed.
Prompts Used
One thing that has been especially helpful while working in Claude Code is the secondary browser tool embedded within Claude’s app. When Claude Code updates something in the project, it can pull up the site and show the changes it’s making in real time. This has been useful because I can point to a feature in the app that I want changed, and Claude can see exactly what I’m referring to. There have been multiple instances where I verbally described an issue to Claude, and it guessed what the problem was instead of seeing it for itself.
An example of me using this feature involved the interactive panels describing the components of the fishing index. I noticed that FishCast was only displaying data samples from 3:00 PM to 10:00 PM, and I wasn’t sure why it wasn’t automatically updating with the hourly forecasts and live data. It was simple to open the browser alongside the chat in Claude Code, so I could ask why it was only showing the data trend during those hours. It turned out to be another hard-coded feature left over from the Claude Design mockup.
I’ve noticed how visually driven Claude is. Not only has part of the internship been learning how to analyze data and develop software, but it has also been about learning how to use AI as efficiently as possible. Working with different AI tools allows you to discover the “trigger words” that make the AI do what you want. This week has been good practice because I’ve focused on giving the LLM smaller, more specific tasks rather than making large changes to the project all at once.
What Worked
As mentioned, I have had good luck opening the Claude browser while working in the Claude Code environment with bug fixes. It just made it easier for me to feed Claude tasks while having a mutual understanding of the visual outcome. This was the exact intention for this feature in the Claude app, and I plan to keep using this going forward.
What Didn’t Work
I’m still having trouble getting the reflectivity frames to run smoothly when projected onto the map. However, I have verified that these frames are being pulled from Terrier properly. Claude suggests it’s a MapLibre bug that causes updates to all data sources to time out, even though the server itself doesn’t crash. This is something I’m still working through, but I am making progress.
Lessons Learned
I learned that being practical is key when working through bug fixes. Building a better understanding of AI tools helps you get the results you want, especially when making quick fixes.
It’s also worthwhile to try all of the features included in an AI subscription, so you can determine which ones are most practical for your project. Don’t shy away from new opportunities because they might end up being exactly what your project needs.
Images/Video
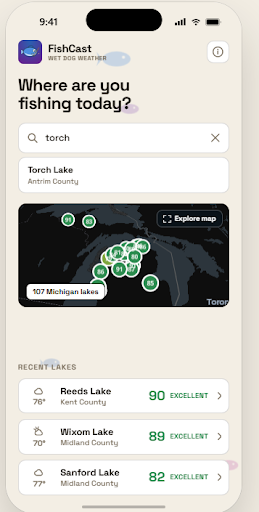
Image 1: Updates to the homepage
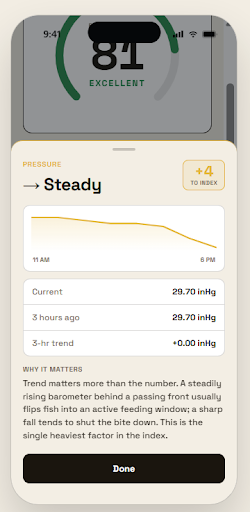
Image 2: Updates to the data trend charts