Goal
- Get reflectivity from Terrier working on FishCast
- Make sure my data auto-updates into the map and forecast pages
- Add additional convenience features on the app
Workflow
I spent all week working within Claude Code to attempt to plot reflectivity. Last week, I was able to get Claude to plot real-time temperature data, wind speed and direction, mean sea level pressure, and cloud cover from Terrier onto my FishCast map. I was debating whether to plot reflectivity because precipitation is not a variable factored into the Fishing Index I created. However, I realized I needed to think more about what people using the app wanted to actually see. While planning a day outdoors, one of the most common questions asked is, “Will it rain?” Therefore, I decided precipitation conditions were important to include in the app as well.
Little did I know, doing this task was going to take up the whole week. Claude was able to successfully plot reflectivity data within Terrier; however, it was only plotting one or two frames and was unable to sync the time slider with the corresponding data visible in Terrier. Claude was doing this because the files were large and looked alike, and my computer had a tough time processing them. I thought I made progress on this Sunday night, but it seemed to only plot the data available for that time and is no longer updating in FishCast. This process has been incredibly frustrating, and I still have not figured out how to get this feature working yet. Thankfully, I have other interns helping me sort out this issue, and I know I can resume this at a later date.
Despite this week’s challenges with reflectivity, I have made great progress in getting my app to auto-update specific to the Fishing Index and each variable pulled from Terrier. Getting this working in Michigan is a huge step for FishCast because the index is essentially the core of the project. This process is moving a lot more efficiently than anything I had to deal with in creating the maps. This makes me curious: how come Claude has no problem pulling raw data and computing an index from it, but projecting any of the variable overlays on the map is like pulling teeth?
Prompts Used
I asked Claude to display reflectivity data within Terrier in a separate tab on the map, like any other variable you can toggle on and off. At first, Claude didn’t seem to understand what that meant, and nothing was plotted onto the map. It seemed that it didn’t recognize what “reflectivity” meant until I took a screenshot of it displayed in Terrier and fed that into Claude. Then, it was able to understand it was trying to display the wrong variable, and it fixed half of the issue. The other half of the issue involved only displaying two data frames and not advancing with the time slider.
Although I am working within the app running from my computer, Claude was somehow unable to see that the frames were not advancing, so I recorded multiple videos for AI to visually notice what was happening (like it didn’t believe me when I asked what the problem was). Looking into the files, I recognize they are large, and my computer has only so much RAM, but I am determined to find a fix for this.
Currently, I have the most recent frame playing in FishCast along with frames from the past few hours, but nothing for the future. According to Claude, the files are too similar to display every few minutes, rather than once every hour, so this is what is working right now. It still takes forever, and I am not impressed with the current results in this sector of the project.
On a more positive note, AI was very responsive to my trigger words: auto update, real time, and current data from Terrier. When I asked it to fix this regarding the daily and hourly forecast outlooks, Claude was able to efficiently recognize what was and wasn’t hard-coded from Claude Design, and I have a mostly functional app regarding the Fishing Index and all of the associated variables.
What Worked
Claude is very visual, so if I want something to look a certain way, it’s easier to take a screenshot or provide a reference so Claude can gauge how to organize it rather than guess. It was helpful for Claude to get a screenshot of the data I can see in Terrier, so it knows what variable I am referring to rather than guessing and getting a fruitless result.
Additionally, Claude helped determine what was hard-coded into FishCast from Claude Design and successfully changed those variables to live data from Terrier. I was impressed with these results after a challenging week working with precipitation data.
What Didn’t Work
Although I have reflectivity plotted and working, it still takes forever to load, and the process itself took a long time. I felt this was a waste of time, and I still need to perfect this feature in my app later.
Lessons Learned
This week proved to me how long it actually takes to get something to display on a map compared to just displaying or computing values. I need to do better in estimating reasonable goals for myself and my progress working within FishCast. It has taken me two weeks to get the data to correctly display on the map. I was hoping AI could speed up this process, but in some instances, it has slowed me down. In the future, I need to set reasonable goals, move on to something more efficient, and circle back to the issue at a later date (after some help).
Images/Video
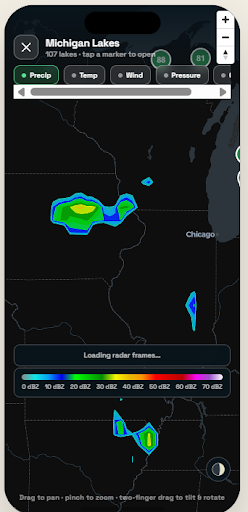
Image 1: Reflectivity plotted from Terrier