

Terrier: Your Energetic Ally in Visualization
- Advanced weather data visualization library
- Stunning, interactive displays on the web and mobile
- Built for fast front-end display

Carrot Weather
Terrier Integrations
Leaflet JS
Integration:
– Provide stackName and Leaflet map
– Terrier integrates as a CanvasLayer for real-time rendering
– Handles reprojection, data sources, and timing automatically
– Delivers variable overlays directly on Leaflet maps
– Lightweight and reliable for web mapping

MapLibreJS
Integration:
– Provide stackName and MapLibre map
– Terrier integrates as a Custom Layer for WebGL rendering
– Controls layer placement within the map stack
– Showcases Terrier’s weather data layers on MapLibre maps
– Compatible with Mapbox JS toolkit features

ArcGIS
Integration:
– Provide stackName and ArcGIS Web map
– Terrier integrates via the Custom WebGL Layer interface
– Supports variable layers across ESRI mapping environments
– Maintains performance and interactivity with large datasets
– Seamlessly extends ArcGIS map capabilities

OpenLayers
Integration:
– Provide stackName and OpenLayers map
– Supports Terrier’s variable layers via canvas shim
– Matches OpenLayers projection matrix for 100% alignment
– Handles animations and weather timing seamlessly
– Efficient rendering with independent layer management

Mapbox
Integration:
– Provide stackName and Mapbox map
– Terrier integrates as a Custom Layer for real-time rendering
– Leverages Mapbox’s high-performance rendering
– Optimized for mobile platforms
– Delivers premium map quality paired with professional weather visualization

White Papers
Terrier Blog Posts

The Hidden Science of Damaging Thunderstorm Winds
Clouds move in accordance with Earth's gravity, and as a result, powerful and interesting phenomena often arise. In this blog post, we will unpack the processes behind damaging thunderstorm winds. In particular: downdrafts, micro- and macrobursts, and squall lines....

What Happens When Interns Build AI-Generated Dashboards?
We have three interns this summer working on AI-generated dashboards using Wet Dog Weather datasets. They've been working for three weeks now, and let's see what they're up to.Air Quality AI-Generated DashboardsWe started them out on an air quality dashboard. A...
New Weather Data Interpolation Options in Terrier
One of the easiest ways to change how data looks is by changing how it's interpolated. The underlying data remains the same, but the method used to sample and display it can dramatically affect what users see on screen. In this update, we're adding a new weather data...
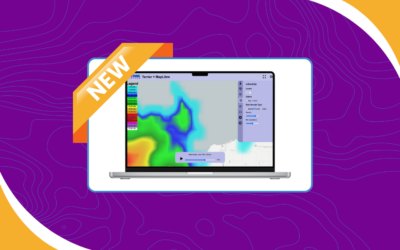
The Ultimate Animated Wind Display (So Far)
We make a visual toolkit for weather called Terrier. It's tied to our own data processing because we need the data processed in a certain way to feed it. It's also much easier to sell a weather data processing platform than it is to sell visualization. One of the...
Meandair Weather Models Now Available
We pride ourselves on processing a wide variety of observational and model data. Years ago, we started with the standard National Weather Service models and NEXRAD radar you'll see in weather apps. Since then, we've added a wide variety of specialized data and weather...

Future Radar in Terrier: How to Get Started
Last week, we introduced Future Radar, our take on advected radar for MRMS. Now that it's live, we’re going to show you how to actually use it across our products. We'll start with Future Radar in Terrier. If you're already displaying radar in Terrier for Web, you're...
Industries
Automotive
Aviation
Consumer
Utilities
Have a project in mind?
Our weather data platform handles everything from standard datasets to custom data, whether purchased or generated in-house. Customers can have their own Boxer stack with access to Terrier front-end tools, and we provide full support for processing, transforming, and delivering weather information efficiently. Customization is where our expertise shines, helping you get exactly the weather insights you need. Let’s work together to bring your next weather data project to life!