Weather data is everywhere, but during severe weather, it’s often scattered across multiple websites and applications.
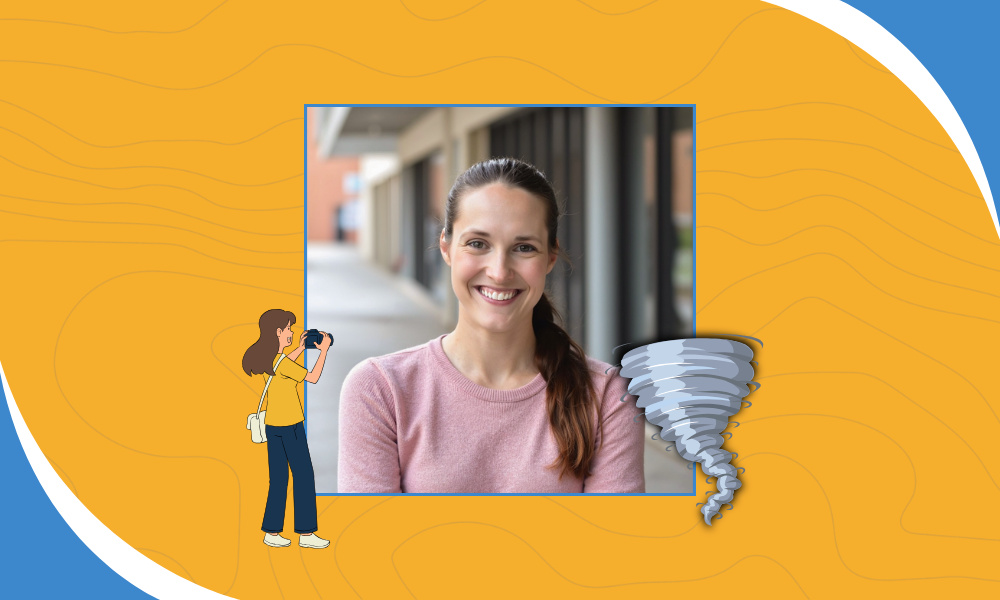
That’s the problem Mississippi State University graduate student Alicia Skiver-Palmer set out to solve this summer by building an AI storm chasing dashboard that brings forecasting tools into a single workspace. By combining AI with Wet Dog Weather data, she’s creating a platform designed to help storm chasers and meteorologists spend less time searching for information and more time analyzing the atmosphere.
Throughout the summer, Alicia has also documented her progress in our AI Journal, sharing the challenges, breakthroughs, and lessons learned as she built her dashboard using AI and Wet Dog Weather data.
From Meteorology to Weather Technology
Alicia’s fascination with weather began long before graduate school.
Growing up, she was always curious about how storms formed and how meteorologists could predict them before they happened. That curiosity eventually led her to Mississippi State University, where she’s completing a Master of Science in Environmental Geoscience.
Along the way, she discovered another passion.
While studying meteorology, Alicia became increasingly interested in the technology behind weather applications. She found herself paying close attention to map design, user experience, and the way weather information is organized, especially during high-stress situations.
“I became really interested in finding ways to take complex weather information and present it in a way that is both visually engaging and meaningful.”
That interest made the internship a perfect opportunity to combine meteorology, software development, AI, and data visualization while building tools that can genuinely help people.
Building an AI Storm Chasing Dashboard
This summer, Alicia has been developing a browser-based AI storm chasing dashboard designed to bring together the forecasting and decision-support tools that storm chasers rely on before and during a chase.
Rather than switching between multiple websites for radar, SPC outlooks, mesoanalysis, model data, atmospheric soundings, surface observations, and navigation, users can access everything from one centralized workspace.
One of her favorite features has been developing the atmospheric sounding system, which allows users to generate Skew-T diagrams, hodographs, and severe weather parameters directly from HRRR model data for nearly any location.
But for Alicia, the project has never been about simply displaying weather data.
“The problem I’m trying to solve isn’t creating new weather data,” she said. “It’s improving how that data is organized, visualized, and accessed.”
By bringing critical forecasting tools together in one intuitive interface, she hopes users can spend less time searching for information and more time evaluating the atmosphere.
Designing for Better Decisions
As the project grew, Alicia realized that building a useful application involved much more than adding weather layers to a map.
Every design decision, from the placement of tools to the organization of information, affects how quickly users can process data during rapidly changing weather situations.
She wanted the dashboard to feel intuitive, allowing storm chasers, meteorologists, and weather enthusiasts to focus on making informed decisions instead of managing dozens of browser tabs.
Throughout the internship, Alicia discovered that building an AI storm chasing dashboard requires balancing technical complexity with a simple, efficient user experience.
AI as a Learning Partner
Although AI helped accelerate development, Alicia says its greatest value wasn’t writing code.
Instead, it became an experienced mentor that helped shorten the learning curve as she explored unfamiliar programming tools, weather datasets, and software concepts.
Rather than spending hours searching documentation, she could ask questions, understand why something worked, and immediately apply what she had learned.
“I was surprised that it worked like my own personal coding expert,” she said.
At the same time, Alicia quickly learned that AI works best when guided by someone who understands the problem they’re trying to solve.
“You have to understand the problem you’re solving, define the user experience, recognize when something isn’t working correctly, and make countless design decisions along the way,” she said. “AI doesn’t replace creativity or problem-solving. It amplifies them.”
Accuracy Matters
One of Alicia’s biggest technical challenges involved building the dashboard’s atmospheric sounding system.
Generating Skew-T diagrams and hodographs from HRRR model data was only the first step. Once everything appeared to be working, she still had to verify that the calculations matched trusted meteorological sources.
That experience taught her one of the most valuable lessons of the internship.
“Working software isn’t necessarily correct software.”
A feature might look professional and function properly, but weather applications also require scientific accuracy. Comparing results against trusted operational datasets and validating every calculation became an essential part of the development process.
Building the Future of Weather Technology
The internship has reinforced Alicia’s desire to build a career at the intersection of meteorology and AI.
She’s excited to continue exploring technologies like machine learning, interactive mapping, cloud computing, and geospatial visualization while developing tools that make weather information easier to understand and use.
As she continues refining her AI storm chasing dashboard and exploring future projects, Alicia hopes to create technology that bridges the gap between complex science and everyday decision-making. Whether working with severe weather, aviation, satellite imagery, or other environmental datasets, her goal remains the same: making weather information more accessible, more intuitive, and more useful for the people who rely on it every day.
See the Finished Project
Watch Alicia’s final presentation from our Summer AI Intern Showcase to explore the features of Storm Pointer and see how the dashboard helps storm chasers analyze severe weather.