Blog
We are Wet Dog Weather, a Software as a Service (SaaS) company that specializes in enterprise-level solutions for weather & sensor data dissemination and visualization.
Looking Beyond the Finish Line
Week 10: Presenting is Part of the Project Week 9: The Challenge of Geospatial Data Week 8: Simple Solutions Work Better Week 7: Understanding the Data Behind the Display Week 6: Building Without Breaking Week 5: Correct Integration Saves Time Week 4: Data Integration...
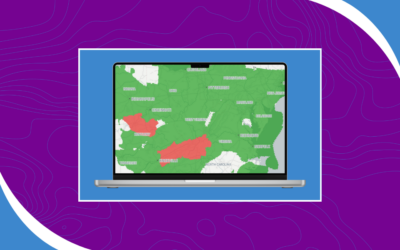
NDFD Weather Codes: A Practical Guide
The National Digital Forecast Database contains much more than temperature and precipitation forecasts. One of its most useful features is NDFD weather codes, which summarize forecast conditions in an easy-to-display, query, and incorporate format for your applications. In this post, we look at how these codes work, what they represent, and why they’re valuable tools for developers building weather-aware software.
Fixing Bugs and Adding Polish
Week 9: The Value of Team Feedback Week 8: Understanding AI Capabilities Week 7: Managing Time and Expectations Week 6: Specificity Is Key Week 5: Overcoming Setup Challenges Week 4: Start With The Big Picture Week 3: Designing Around User Needs Week 2: Seeking Advice...
Presenting Is Part of the Project
Week 9: The Challenge of Geospatial Data Week 8: Simple Solutions Work Better Week 7: Understanding the Data Behind the Display Week 6: Building Without Breaking Week 5: Correct Integration Saves Time Week 4: Data Integration Is More Complex Than It Looks Week 3:...
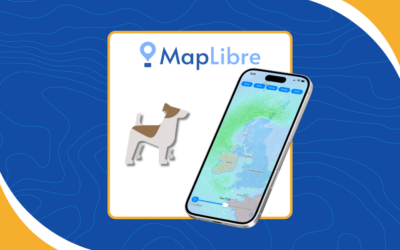
MapLibre Native Weather Integration Now Available in Terrier
Terrier’s MapLibre weather integration brings high-performance weather visualization to MapLibre Native for iOS. Learn how the integration works, why we contributed improvements back to the open source project, and how to start using it in your own app.
Context Leads to Better Results
Week 8: Good Documentation Pays Off Week 7: Wrapping Up the Pilot Experience Week 6: One Task at a Time Week 5: Building on a Strong Foundation Week 4: Choosing a Clear Direction Week 3: Designing for Different Users Week 2: Organization Improves AI Results Week 1:...
The Value of Team Feedback
Week 8: Understanding AI Capabilities Week 7: Managing Time and Expectations Week 6: Specificity Is Key Week 5: Overcoming Setup Challenges Week 4: Start With The Big Picture Week 3: Designing Around User Needs Week 2: Seeking Advice Leads to Success Week 1: Staying...
The Challenge of Geospatial Data
Week 8: Simple Solutions Work Better Week 7: Understanding the Data Behind the Display Week 6: Building Without Breaking Week 5: Correct Integration Saves Time Week 4: Data Integration Is More Complex Than It Looks Week 3: Turning Data Into Decisions Week 2: Making...

Meet the Intern Building an AI Storm Chasing Dashboard
Weather data is powerful, but it’s often spread across multiple websites and applications. This summer, Mississippi State University graduate student Alicia Skiver-Palmer is building an AI storm chasing dashboard that brings radar, forecasts, atmospheric soundings, and decision-support tools into a single intuitive workspace. Along the way, she’s learning how AI, software development, and meteorology come together to create technology that helps people better understand severe weather.
Have a project in mind?
We are a Software as a Service company, and we charge accordingly. Our customers rent their own Boxer stack and gain access to our Terrier front-end libraries. We process a variety of standard data sets, which is…. standard. But we also process custom data you may buy or generate yourself. That’s where things get interesting