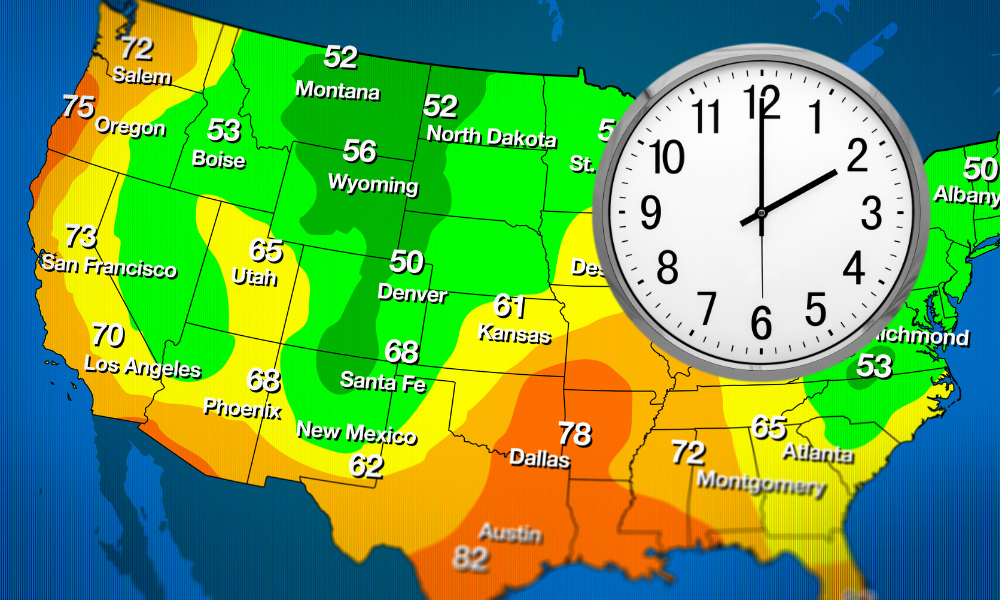
by Steve Gifford | Aug 21, 2024 | Data
At our company, we’ve spent years refining our approach to weather data processing and display. Through this experience, we’ve uncovered several crucial insights about handling time in the context of weather forecasts and user interfaces. Time Zone...

by Steve Gifford | Jul 10, 2024 | Data
The evolution of cloud computing is truly remarkable, especially for those who’ve been in the field for a while. I recall the days of naming individual servers, monkey species were my favorite, and meticulously maintaining hardware. Now, with technologies like...

by Steve Gifford | Jun 27, 2024 | Data, Terrier
At Wet Dog Weather, we have our own web and mobile display technology called Terrier. It’s crazy good, and we love it! However, we understand that sometimes you need to support the old way of doing things, which is why we also support traditional web mapping...

by Christy Rohrig | Jun 4, 2024 | Data
At Wet Dog Weather, our expertise in designing resilient infrastructure has enabled us to achieve an impressive milestone: zero production downtime over the past two years. Our commitment to robust data workflows, effective weather data management, and advanced...

by Steve Gifford | May 22, 2024 | Data
We’ve discussed our approach to dev ops before, specifically how we use CDK with Python in our weather stack deployment. It’s something we like to talk about, so let’s do an update! Weather Stack Background Compared to most of our competitors, we...
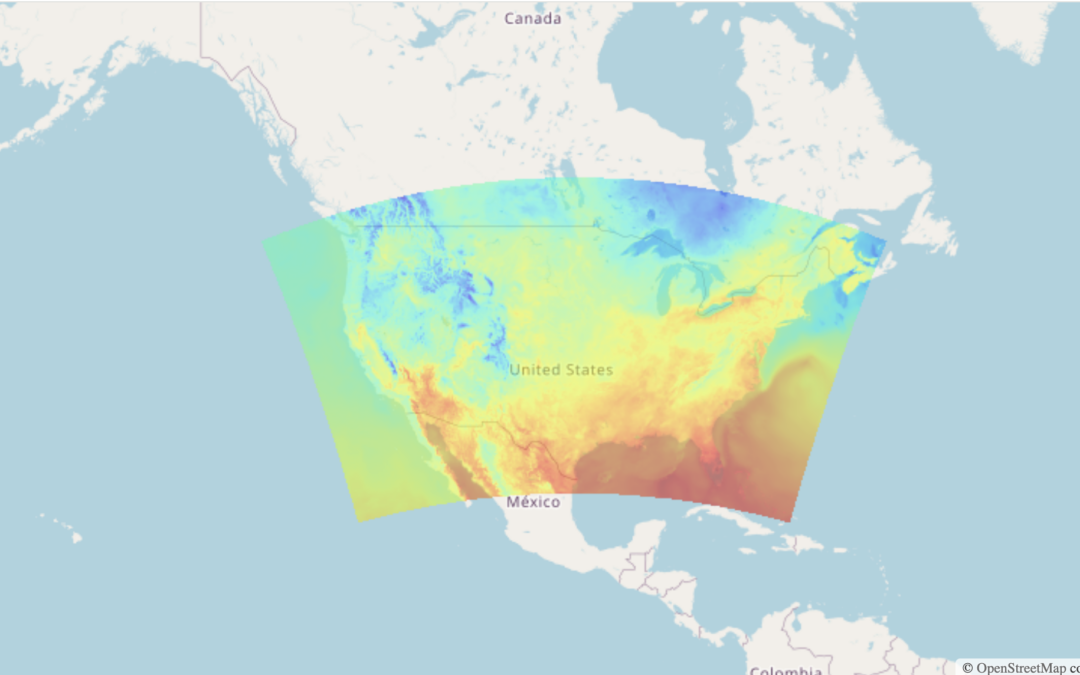
by Steve Gifford | May 15, 2024 | Boxer, Data, Terrier
At Wet Dog Weather, our main task is weather data visualization. Our weather map tiles are fast! The whole process is easy, and it looks amazing. We combine a ton of data on the fly in our Terrier for Web SDK. That’s the best way to get the most out of Boxer and...