At Wet Dog Weather, our main task is weather data visualization. Our weather map tiles are fast! The whole process is easy, and it looks amazing. We combine a ton of data on the fly in our Terrier for Web SDK.
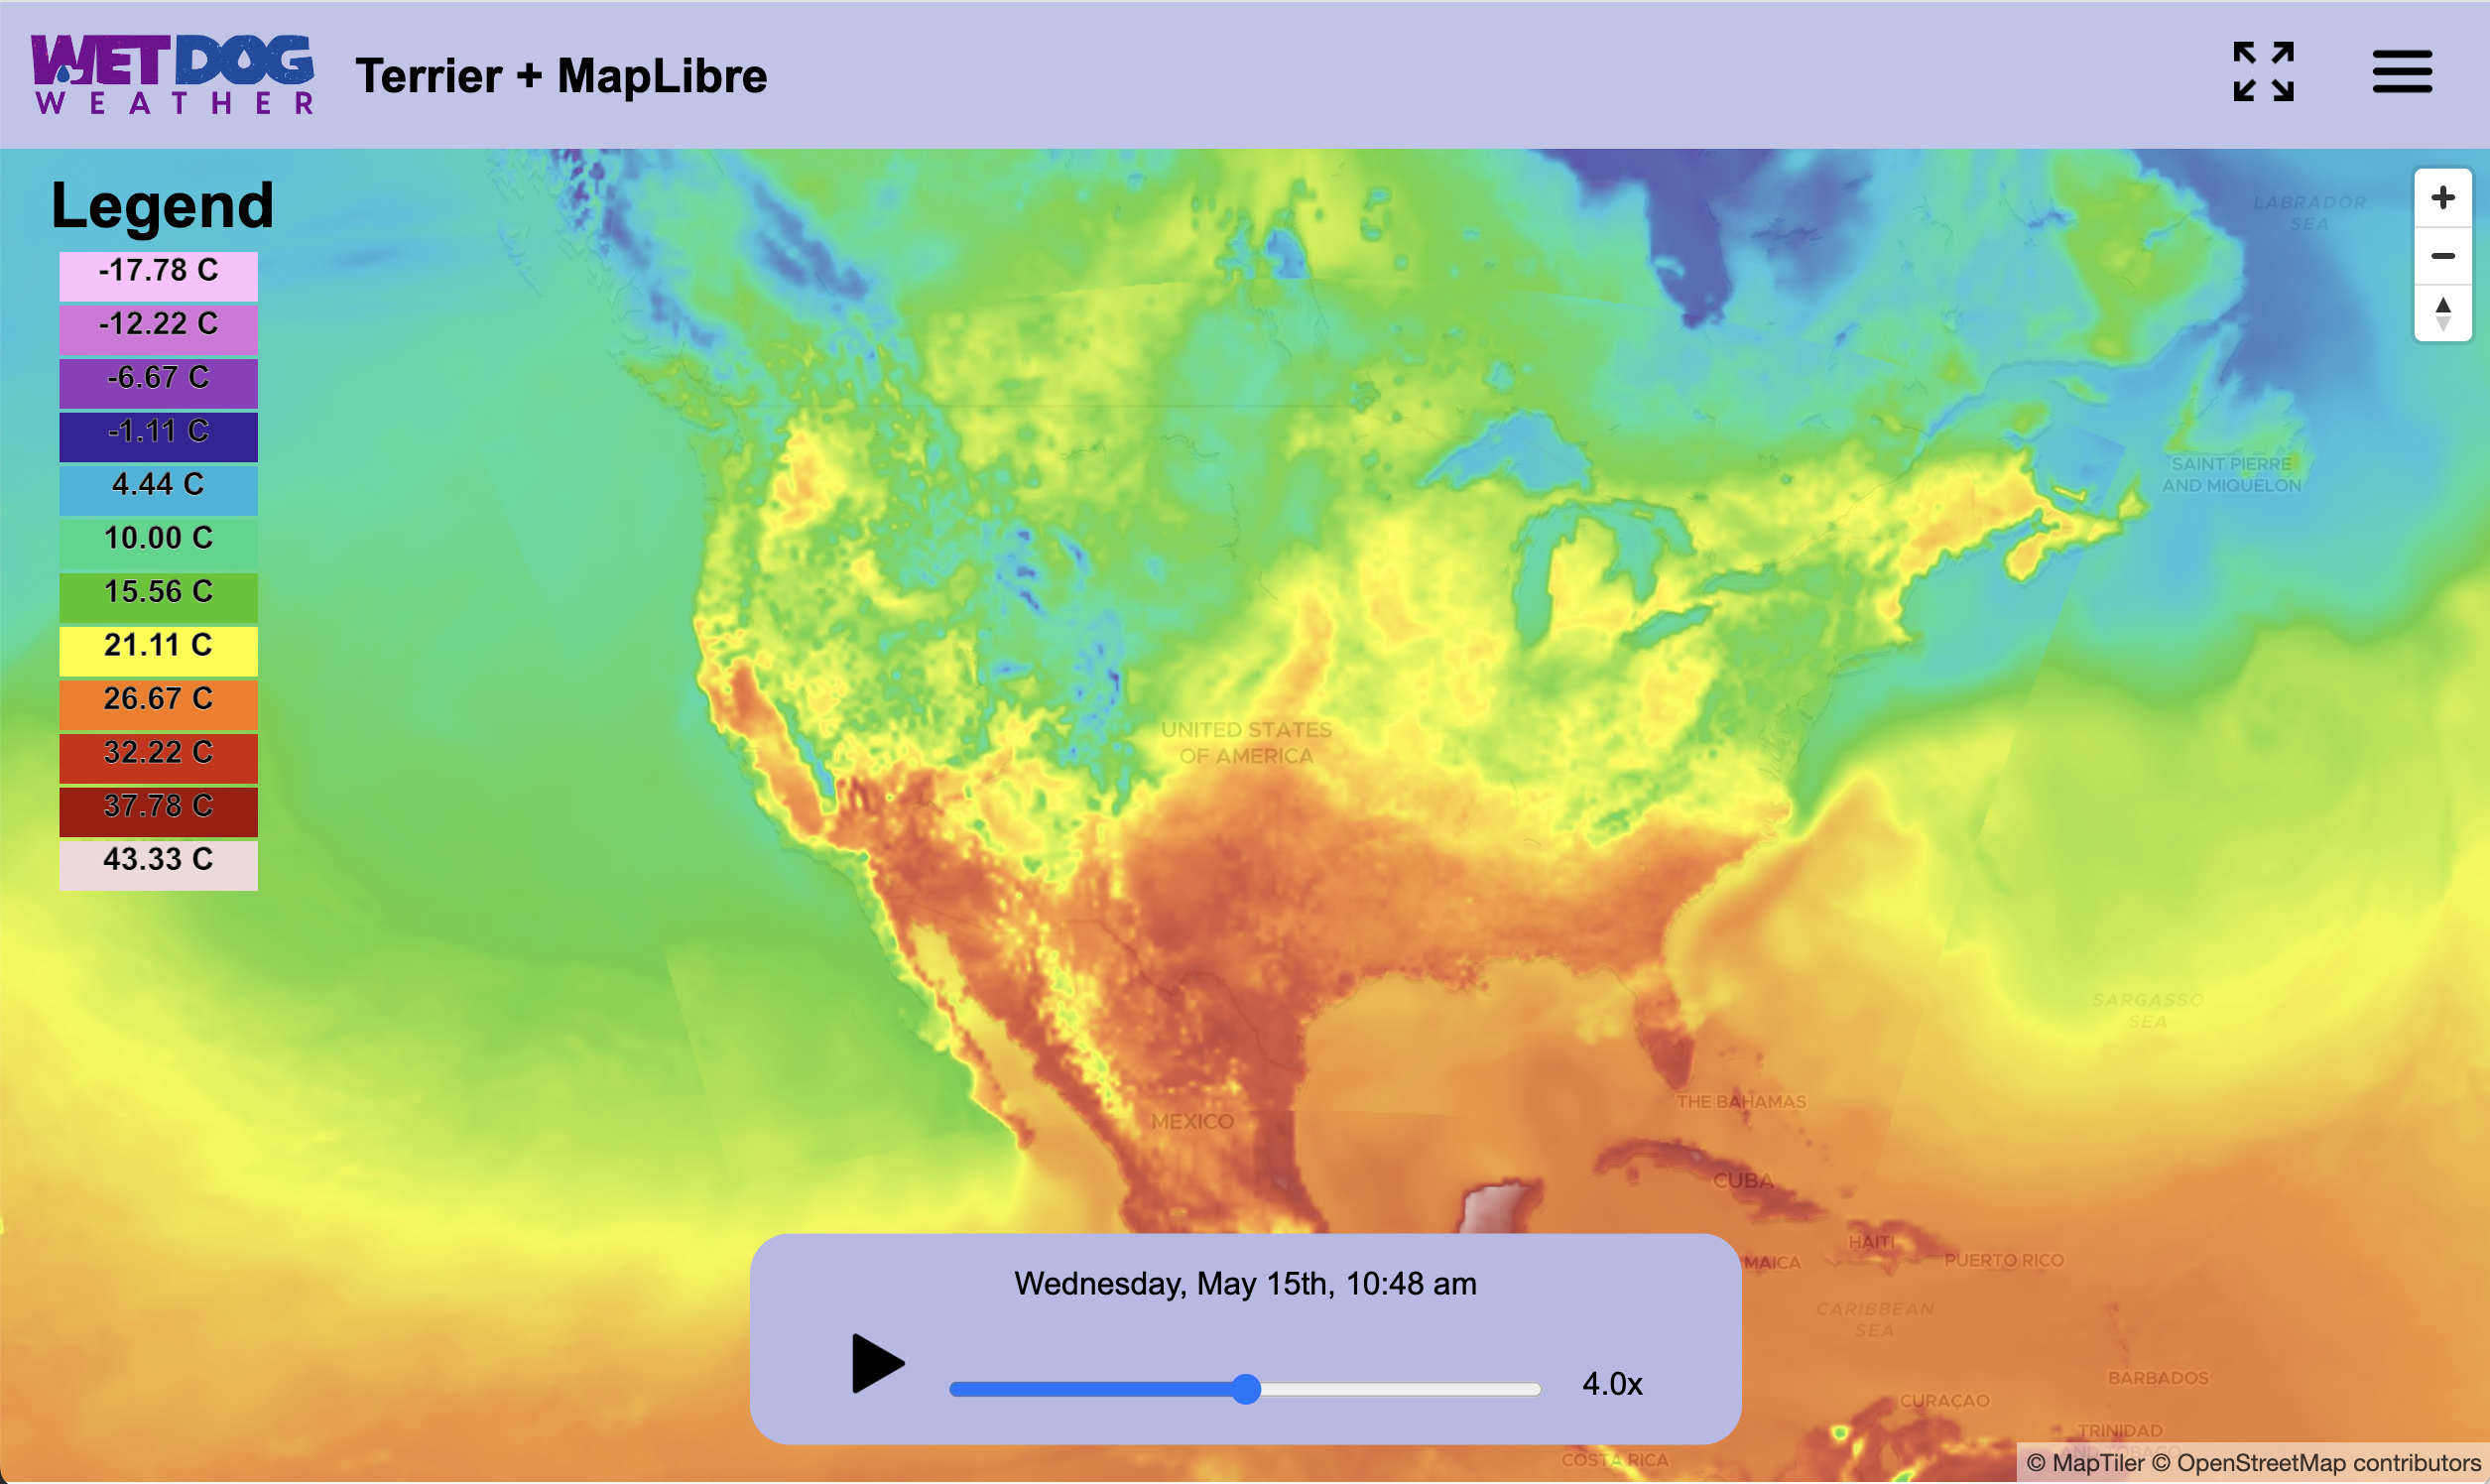
That’s the best way to get the most out of Boxer and Terrier, and we love this approach, but sometimes, you have to do it the old-fashioned way.
Web Map Technology
There are many ways to display weather data in map form. The one most suited to non-expert users or even experts in an adjacent field, like aviation, is an interactive web map.
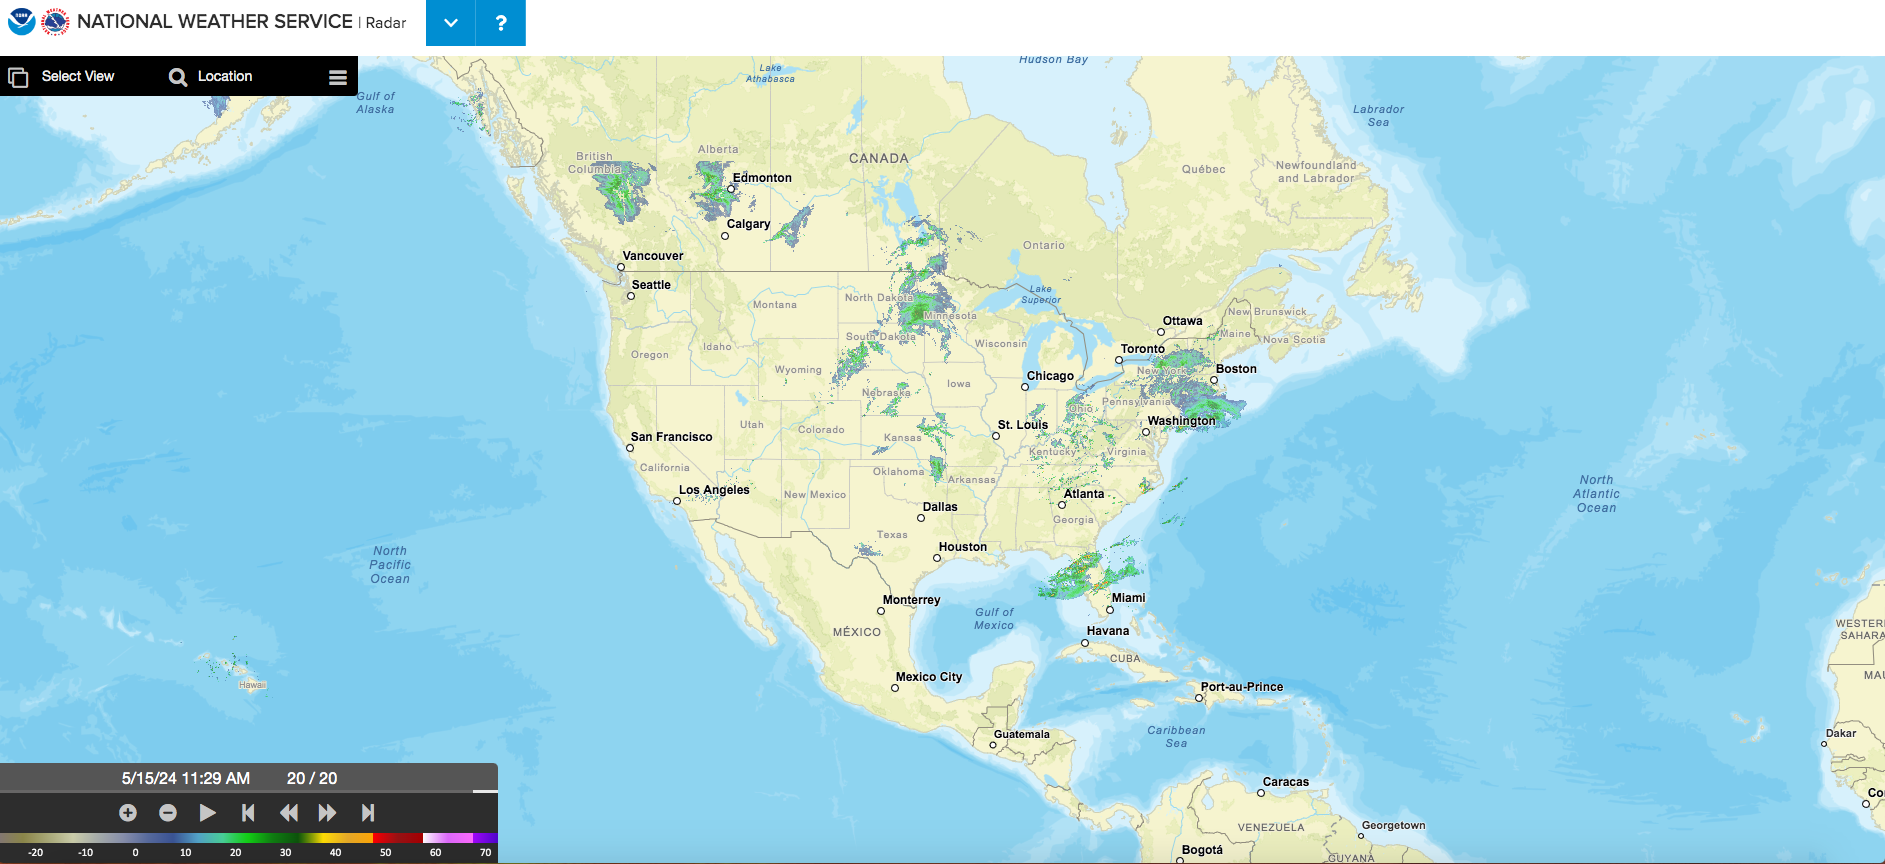
When introduced, interactive maps were a huge step forward. They try only to load what the user is looking at. They can even do animation—as long as you keep it simple.
Most of these maps are based on a pyramid of tiles (TMS) or the more comprehensive Web Map Tile Service (WMTS) standard. We can do that too.
Are Wet Dog’s Weather Map Tiles Fast?
These standard web maps are not our main thing, but sometimes, our users need web maps for backward compatibility. What the user needs, the user gets!
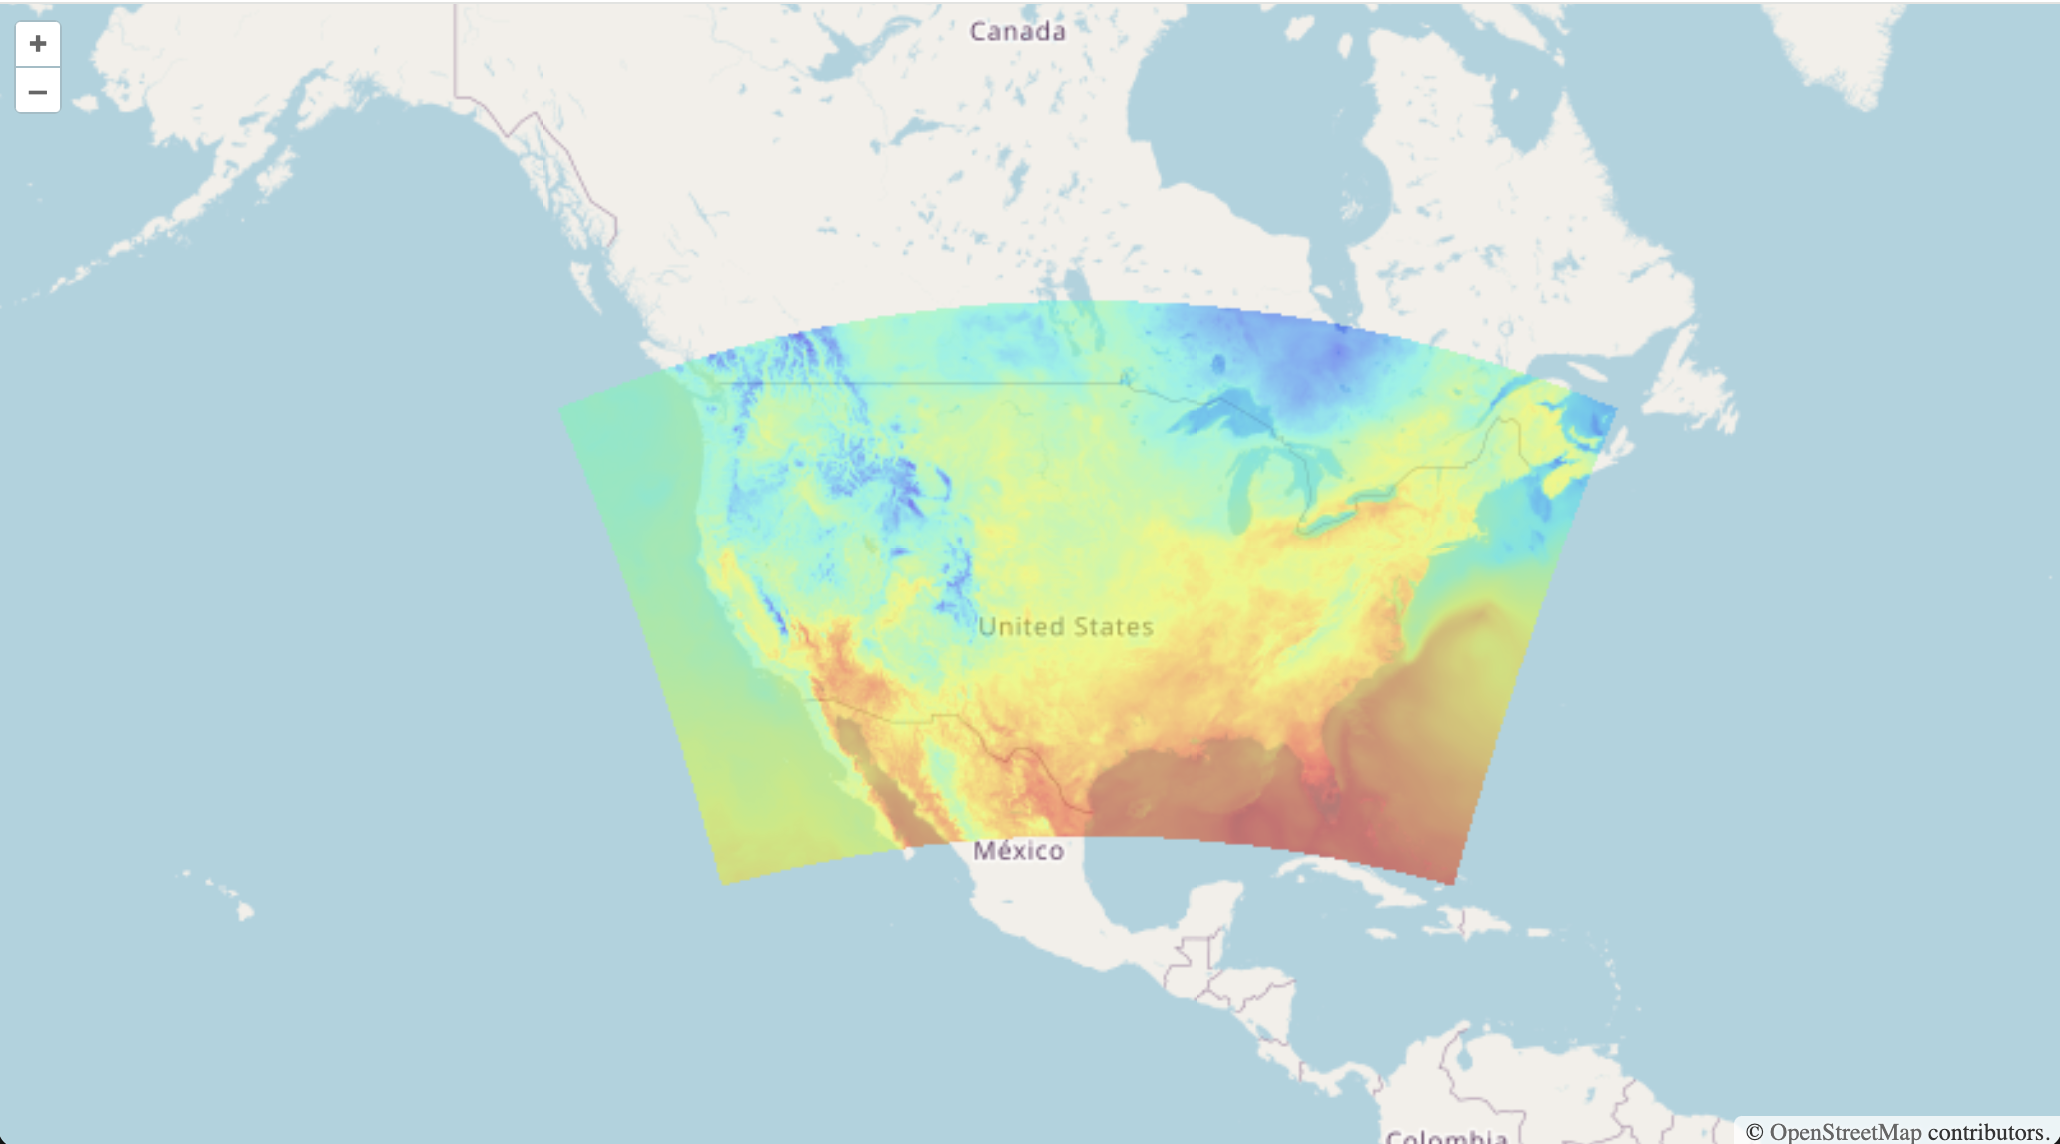
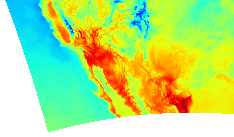
This image shows an HRRR 2m temperature projected into Web Mercator in OpenLayers.
The other day, a customer commented that our WMTS tiles were very fast. My first thought was, “Are they, though?”.
After a bit of testing, I found the weather map tiles coming back at around 200ms to 400ms for a decent number of animated time slices. Our own data tiles tend to come back in the 100ms range if the Content Delivery Network (CDN) isn’t primed. If the CDN is primed, it’s more like 20ms.
I’m not sure 400ms is fast enough for visual tiles, but then I’m obsessed with latency. The customer has shown us a previous solution that returns visual tiles in the multi-second range, so this is an improvement!
Just a note to our fellow weather visualization practitioners: If I hit your endpoint and it’s not going through a CDN, I start to question my own sanity, not to mention yours.
How Visual Tile Queries Work in Boxer
When we build these systems, we make them cloud-native and build them to scale. Everything should be fast on its own, and it should get faster if we add more independent units.
For the visual (WMTS) tiles we have a two stage process that starts when a new model time slice comes in.
- We rip out the variables we want and convert them to our own data tiles first
- Each variable is then reprojected into Web Mercator
- The big slices are tiled and stored on s3 for use in the second part
When a client app requests a particular WMTS tile with a colormap, we do the following:
- Pull the correct data tile from s3
- Pull the colormap
- Apply the colormap to the data tile
- Encode the image and return it
This process works well and scales as much as we’d like with relatively simple compute instances. When using a CDN, it works better the more users you have.
Are Our Weather Map Tile Queries Fast Enough?
Never! It could always be faster!
We could optimize that colormap step better, pre-populate more map projections, prime the CDN, and do this work closer to the edge.
I’ll grudgingly admit it’s not too bad, but if you can use Terrier for Web, you should. That’s even faster.
