Previous Posts
- Week 9: Context Leads to Better Results
- Week 8: Good Documentation Pays Off
- Week 7: Wrapping Up the Pilot Experience
- Week 6: One Task at a Time
- Week 5: Building on a Strong Foundation
- Week 4: Choosing a Clear Direction
- Week 3: Designing for Different Users
- Week 2: Organization Improves AI Results
- Week 1: The Importance of Staying Organized
Goal
- Optimize the applications for better loading times and integrate Wet Dog Weather’s Meandair turbulence model.
Workflow
Since our final presentations, I’ve made small changes, mainly optimizations to improve loading speeds and add other quality-of-life features. Since I didn’t have any new features to add, I integrated Meandair’s turbulence model, provided by Wet Dog Weather.
I did this for both RuffRide Pilot and Passenger. I first verified I could run the model visually on RuffRide Pilot before adding it to the Passenger version. Image 1 shows the visual layer in real time on RuffRide Pilot. To add this, I gave Claude Code a pre-written MD document with integration instructions. A coworker provided this document for me. There are a few differences between Meandair’s model and NOAA’s GTG:
- NOAA GTG
- Data for altitude levels from 3k feet to ~50k feet.
- 18-hour forecast time, hourly updates
- Meandair
- Data for 3 flight levels, 1k feet, 3k feet, and 9k feet
- 24-hour forecast time, hourly updates
Once Meandair was successfully integrated, I added it to the calculations in RuffRude Passenger. For Passenger, I decided to have both NOAA’s GTG and Meandair’s model working side by side. Both feed into the final comfort score calculations. Having more than one source can enhance the score, especially during ascents and descents since that’s where Meandair lives.
While the current state of RuffRide Passenger and Pilot may not be ready for the public, it’s a true working product. Many people I’ve interviewed have voiced support for a product I worked on. I’ve learned a lot working on these, and I definitely plan to keep a pin on them after the internship ends.
Prompts Used
Prompting went as usual this week, with the addition of my coworker’s MD explanation of how to properly integrate Meandair. Optimization prompts had the AI evaluate the entire project to look for potential fixes.
What Worked
Meandair’s turbulence data, delivered through Wet Dog Weather, integrated seamlessly with my application. When combined with additional weather variables, it provided a solid foundation for calculating the Comfort Score, yielding results that aligned well with the overall flight experience I wanted to represent.
What Didn’t Work
There were no significant issues or setbacks this week. The existing data integrations and application features worked as expected, allowing me to focus on refining and validating the project rather than troubleshooting problems.
Lessons Learned
As AI continues to evolve and integrate into our everyday lives, a lesson I’ve learned this summer is not to get left behind. Even outside of this job, I’ve found new ways to use AI in my personal and academic life. I’m going to keep working on context management with AI and push its limits. I truly believe that for those in my generation and those who follow, there’s going to be a sharp line between those who are “AI literate” and those who are not.
Thank you for keeping up with my work at Wet Dog Weather this summer!
Images/Video
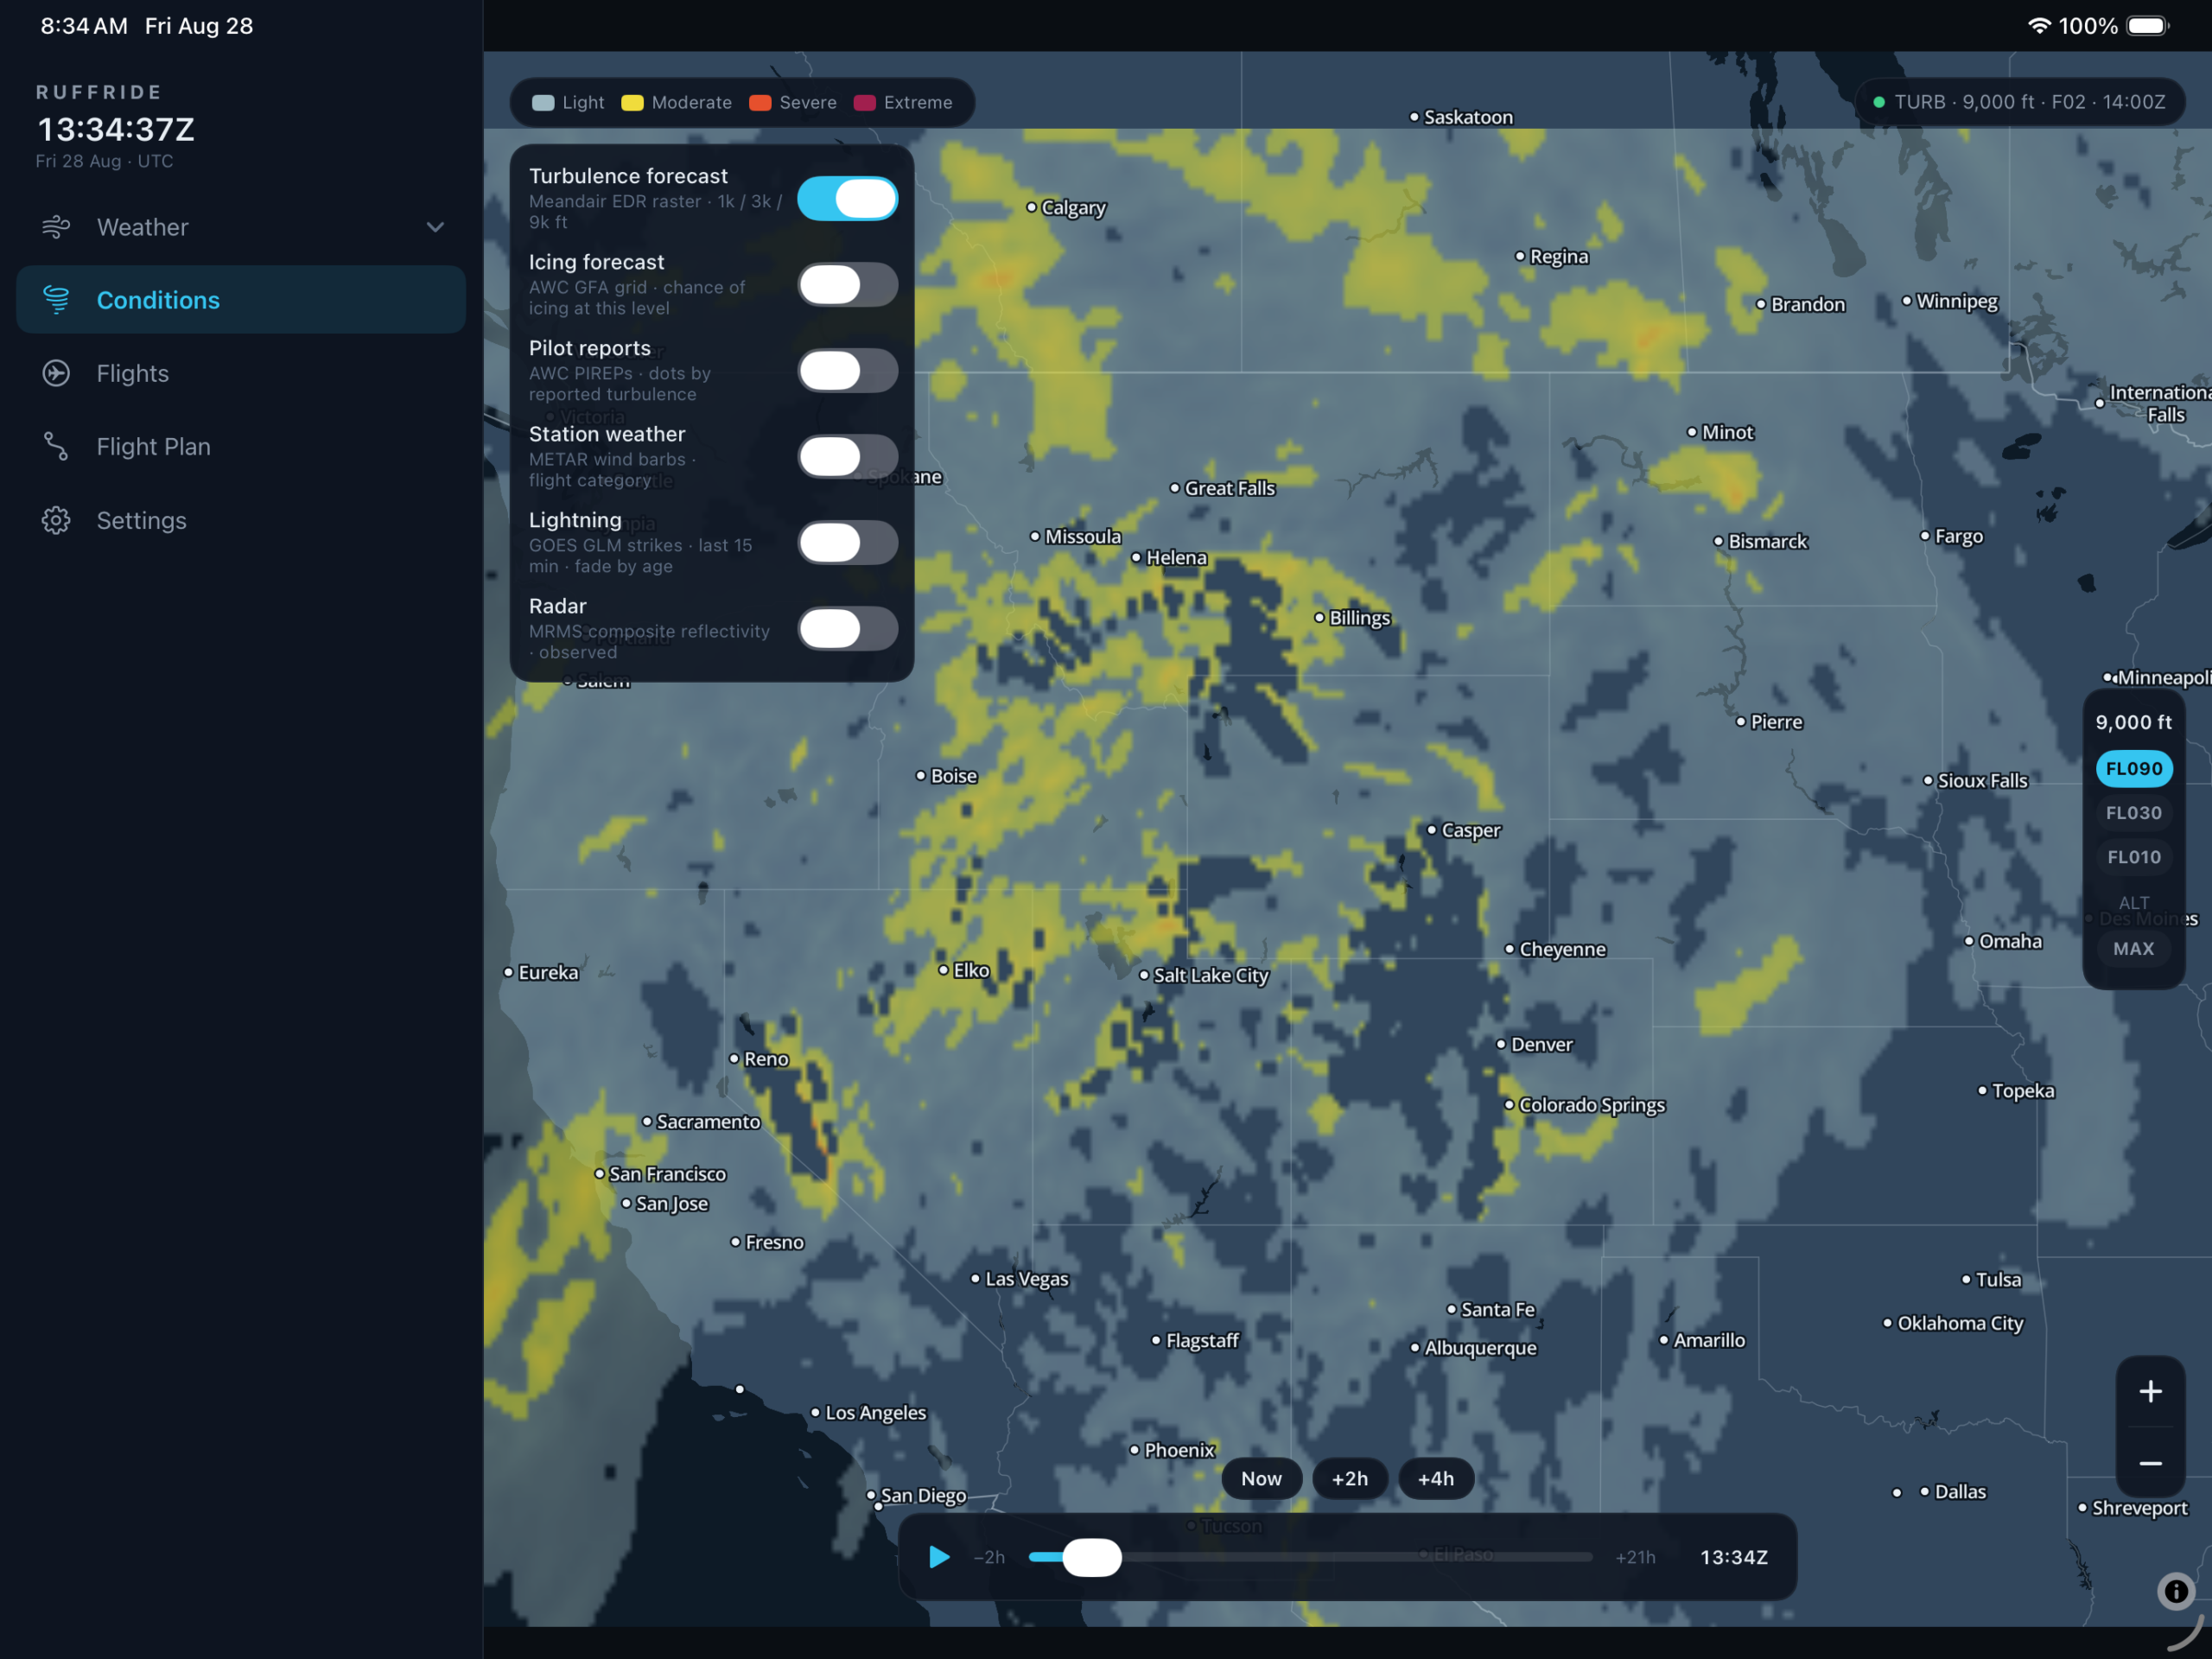
Image 1: Meandair Data Working
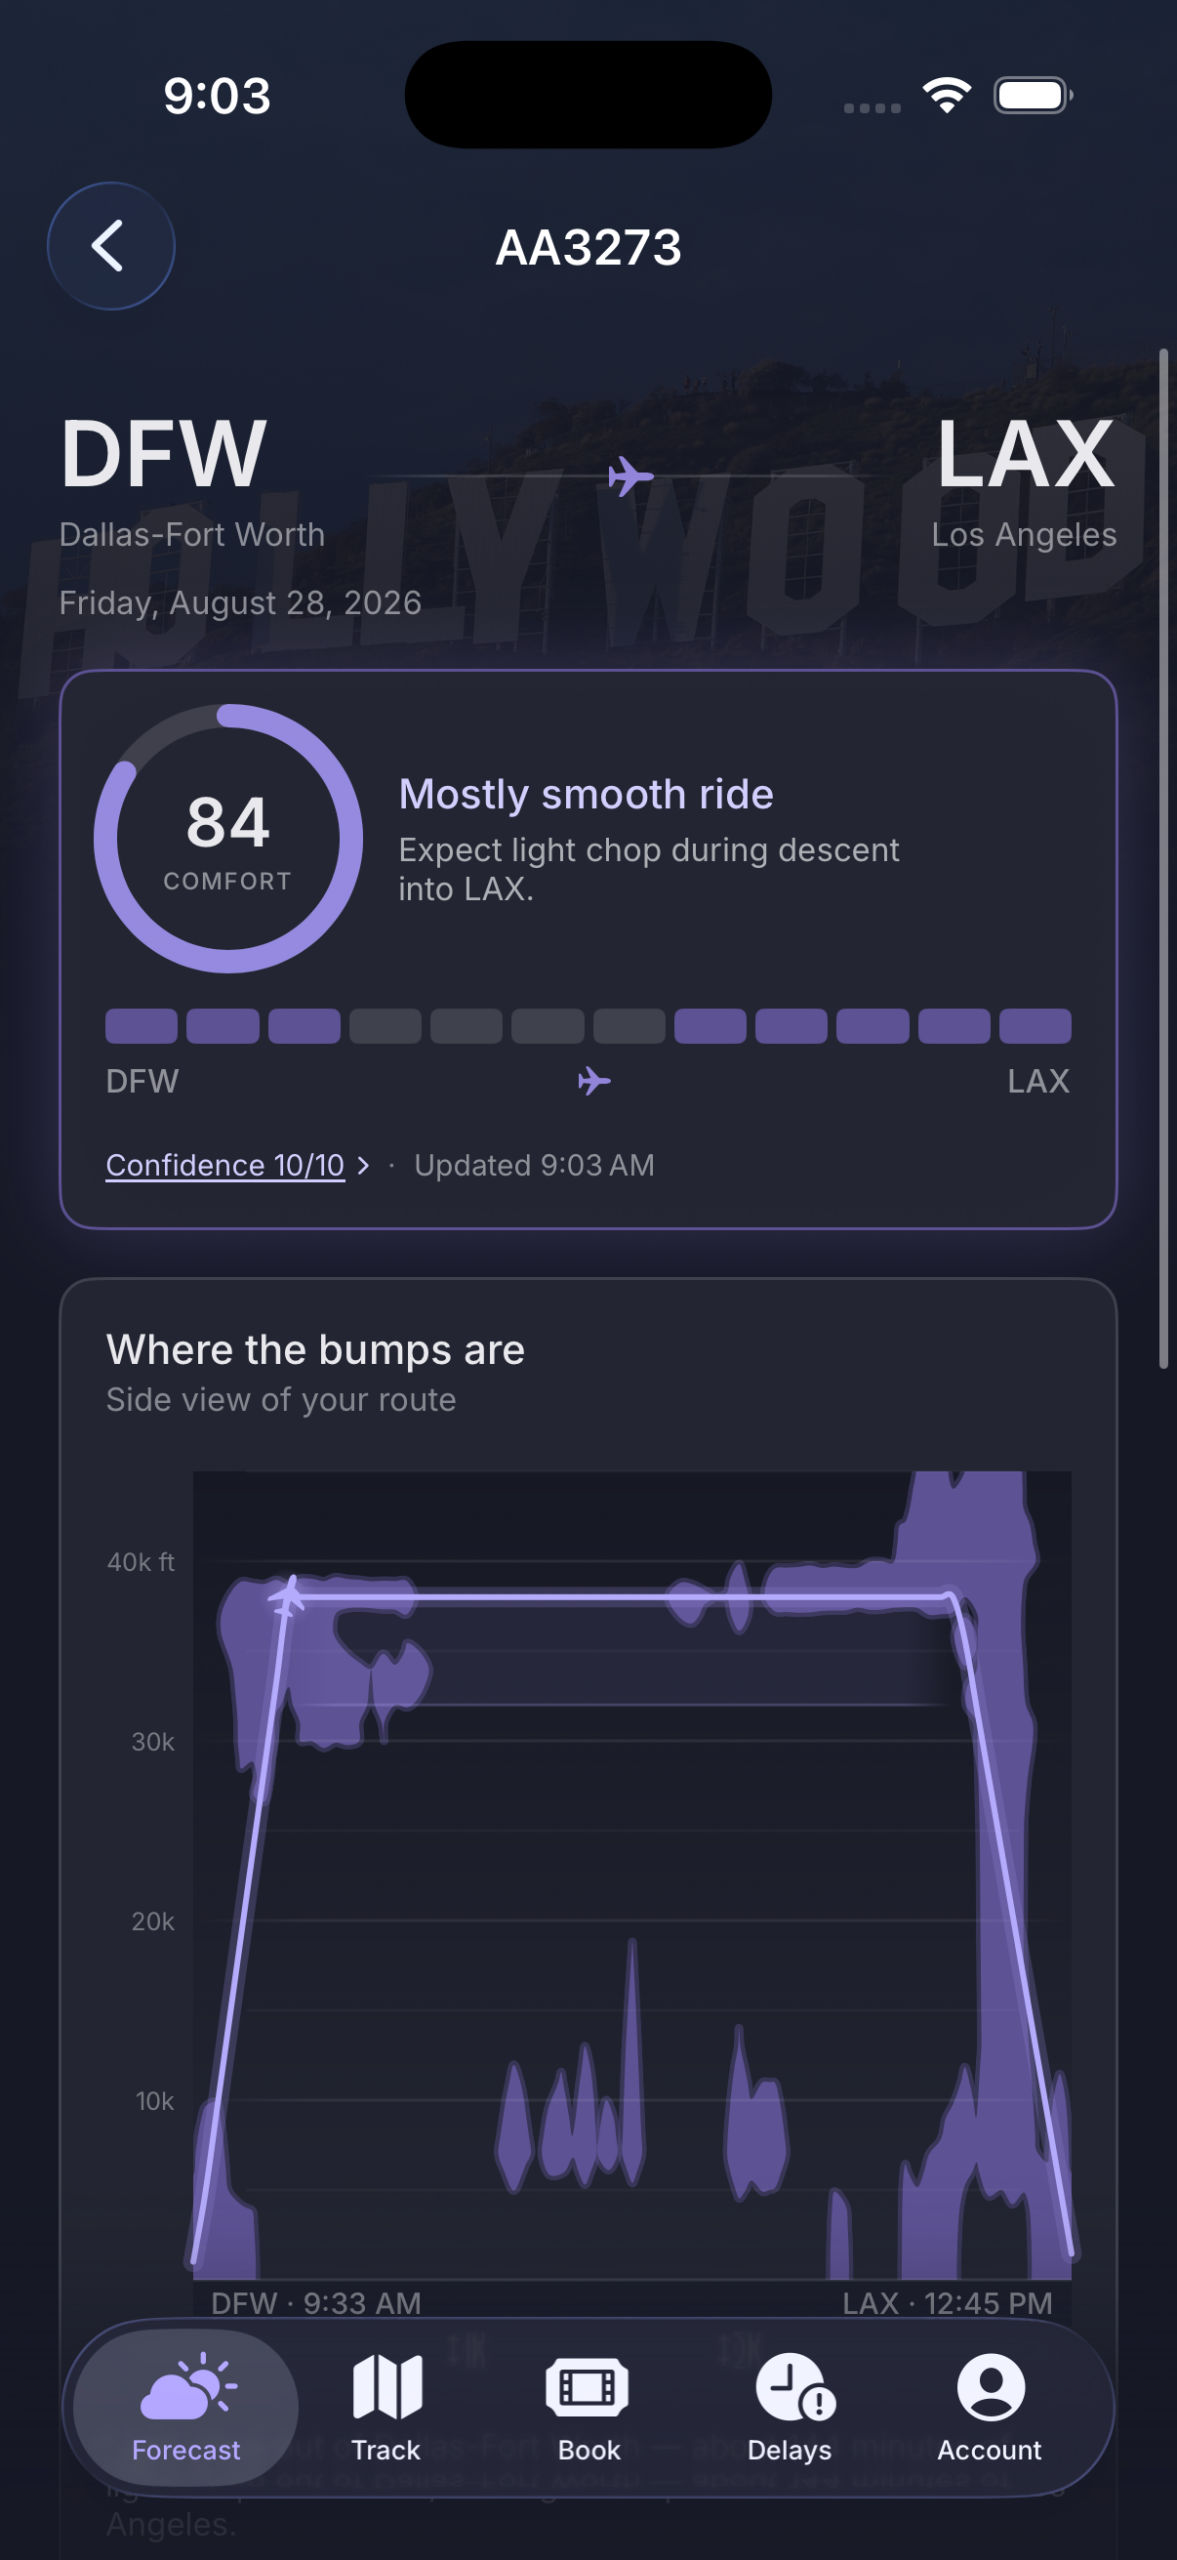
Image 2: Comfort Score
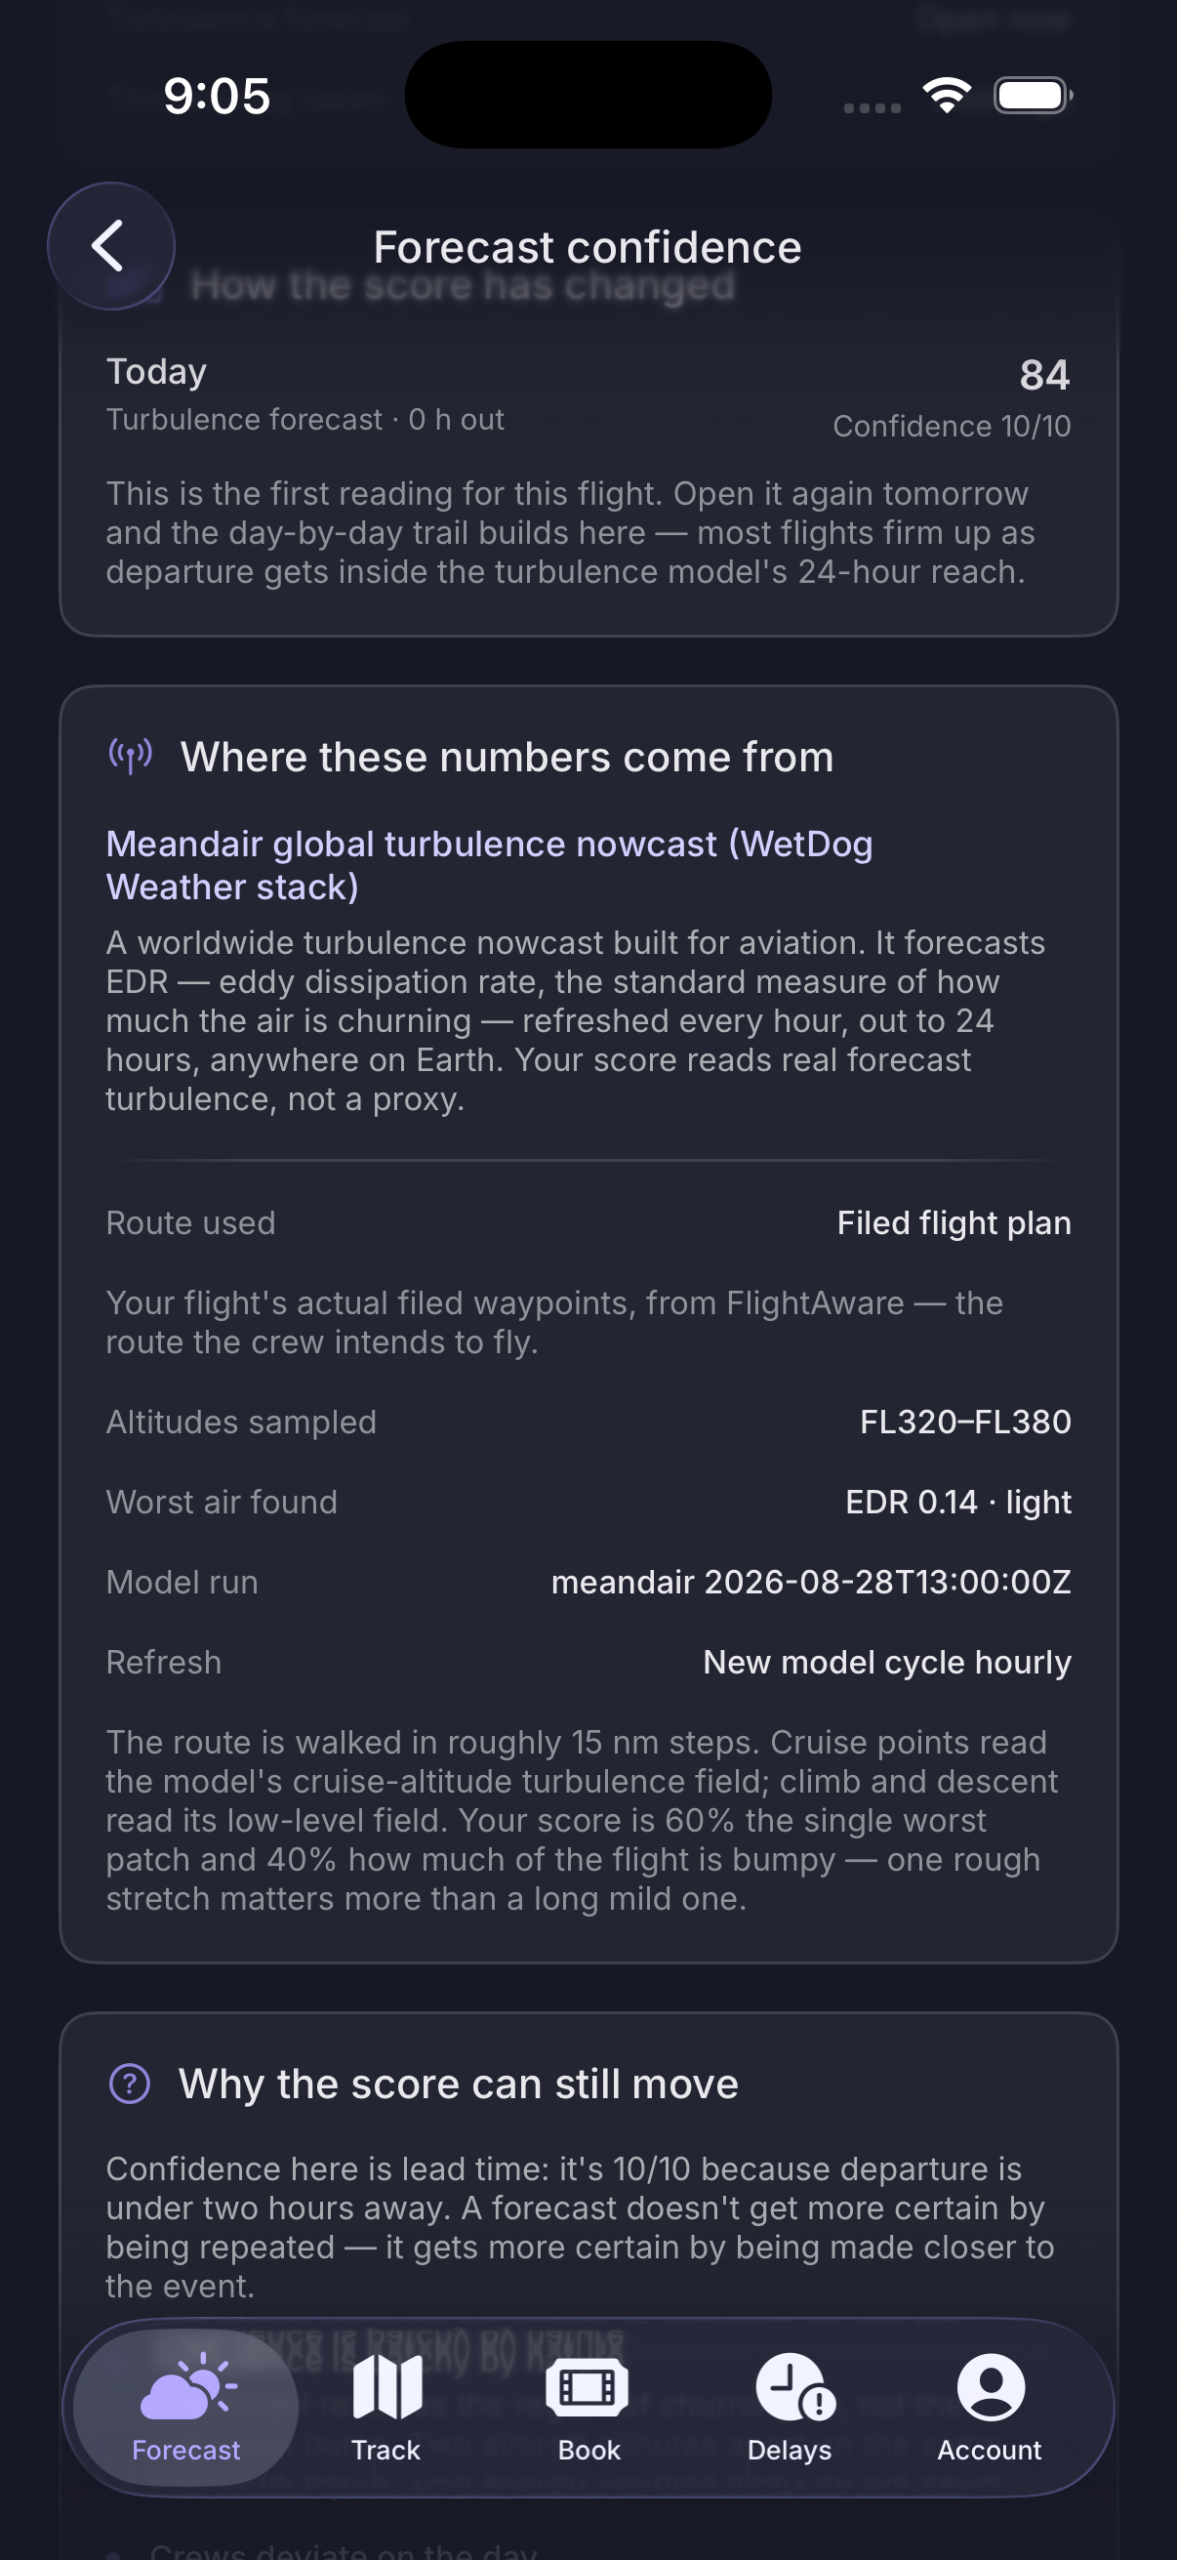
Image 3: Explanation of Data Used
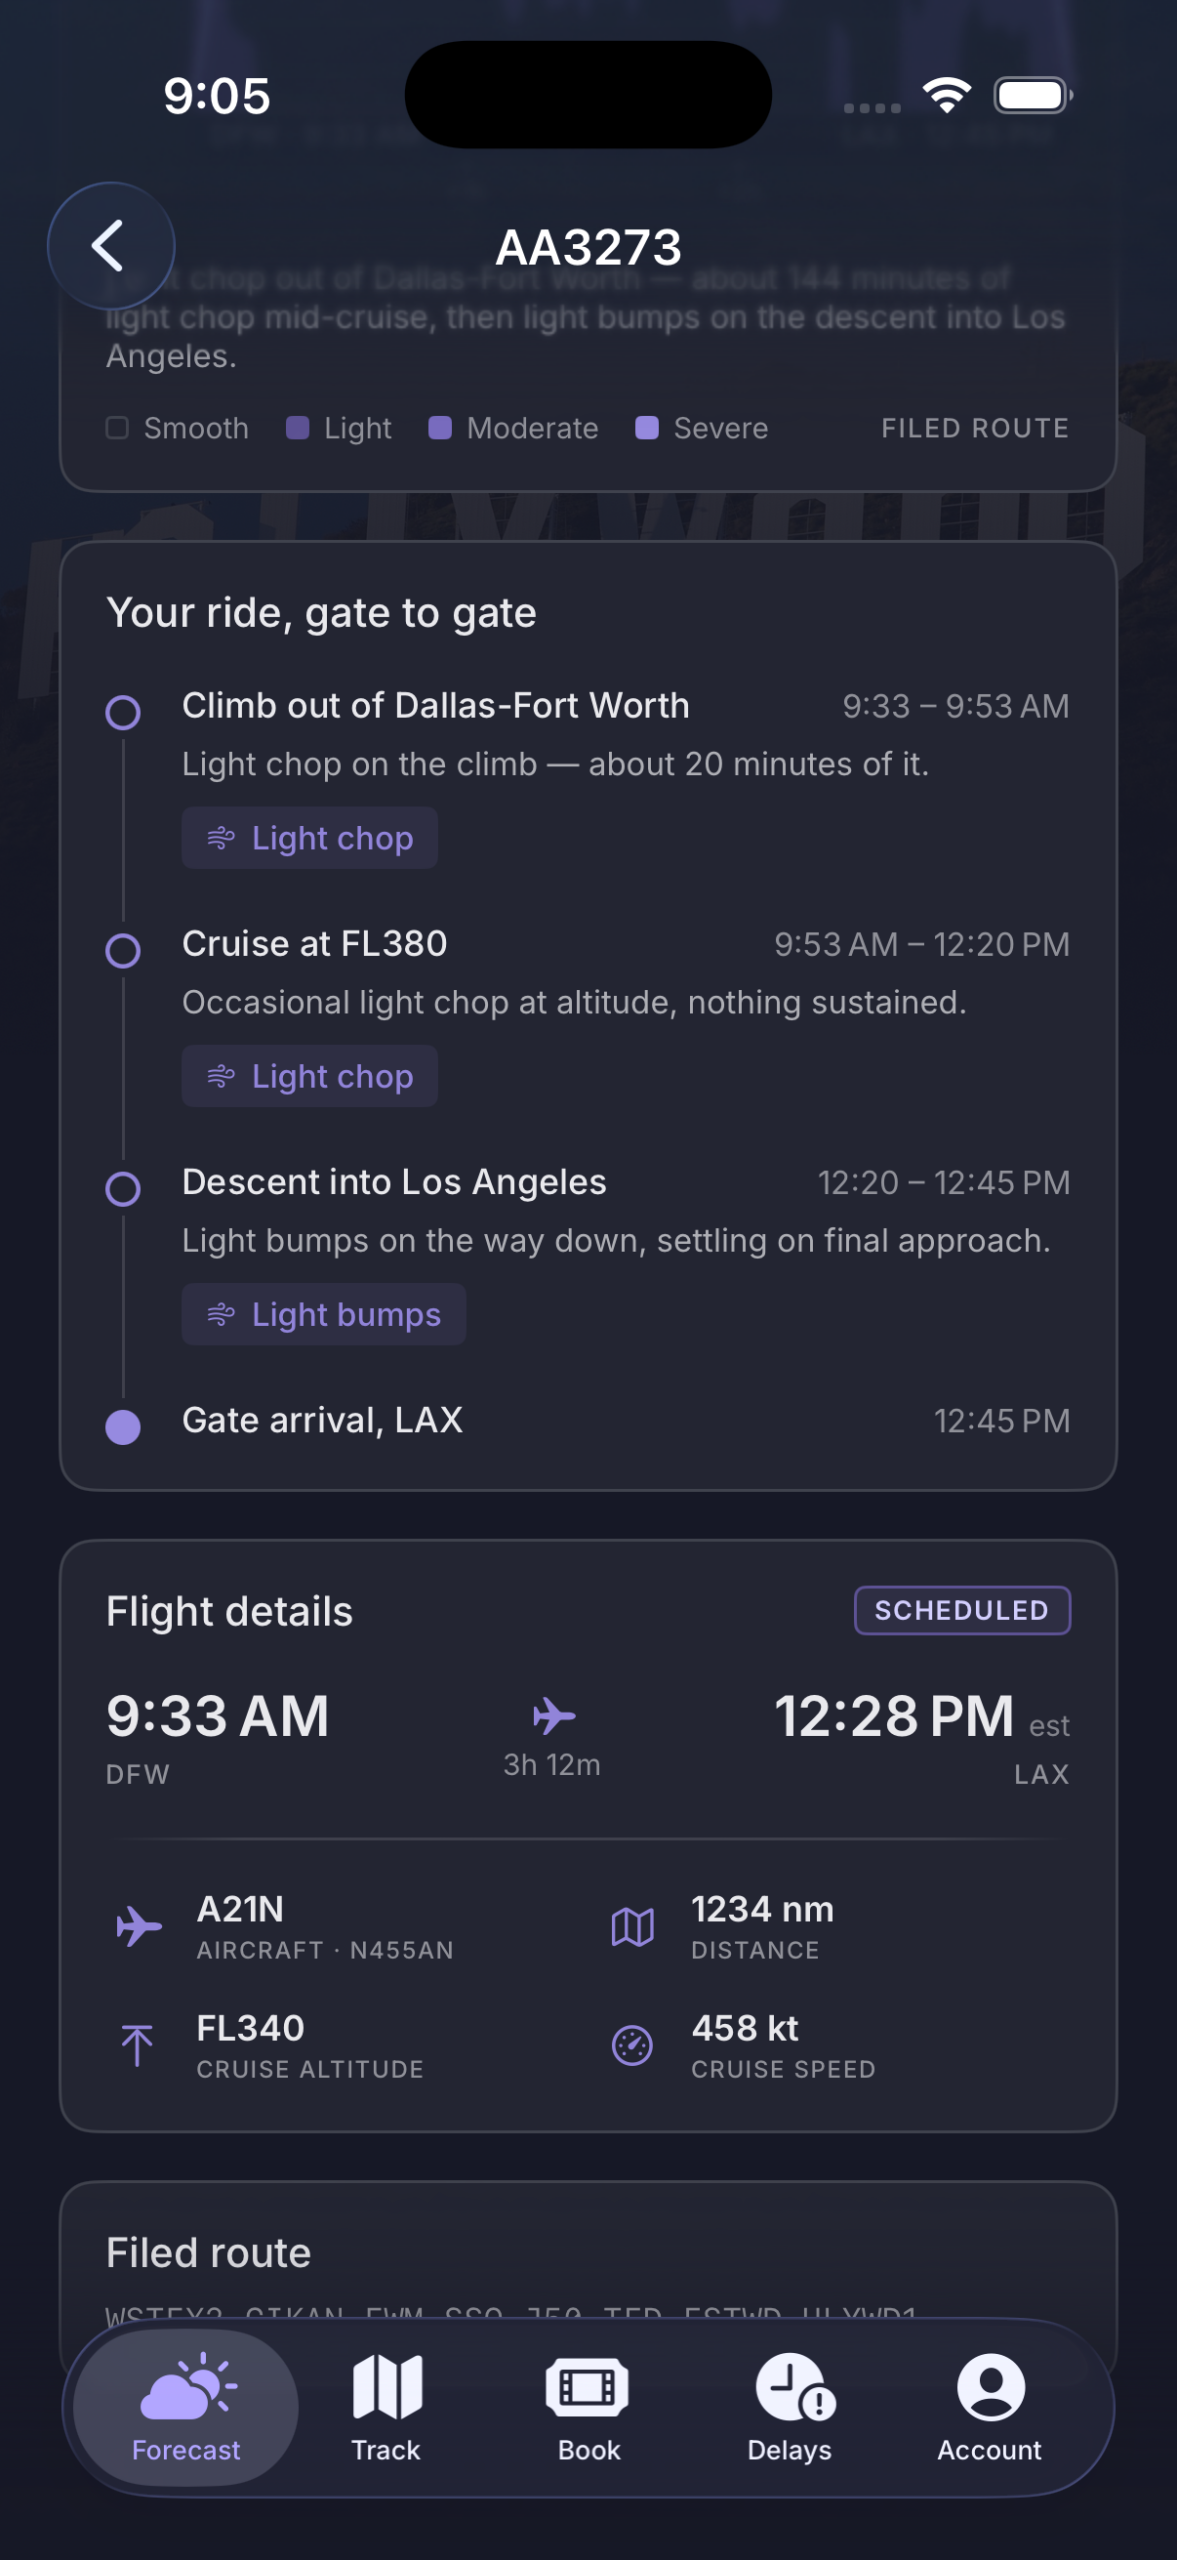
Image 4: Turbulence Timetable