Previous Posts
- Week 11: Looking Beyond the Finish Line
- Week 10: Presenting is Part of the Project
- Week 9: The Challenge of Geospatial Data
- Week 8: Simple Solutions Work Better
- Week 7: Understanding the Data Behind the Display
- Week 6: Building Without Breaking
- Week 5: Correct Integration Saves Time
- Week 4: Data Integration Is More Complex Than It Looks
- Week 3: Turning Data Into Decisions
- Week 2: Making Data Actionable
- Week 1: Building Knowledge Before Making Changes
Goal
Continue improving the route and safety features in Storm Pointer by making the route more useful during active chases and by adding current road-condition information.
Workflow
- Continued improving the route section so users can navigate from their current location to a chase target.
- Changed the route experience from only showing the full route overview to a more first-person navigation-style view that is easier to follow while driving.
- Researched nationwide sources for road construction and closures.
- First implemented USDOT WZDx data, but the mix of points and road segments made the map too cluttered, and coverage was inconsistent.
- Researched other options and switched to the TomTom Traffic API for a cleaner way to show traffic, construction, closures, accidents, lane restrictions, and other road disruptions.
- Began combining these into one Road Conditions layer that can be viewed with the active chase route.
- Continued troubleshooting the Surface Analysis and Surface Prog overlays so they align correctly with the MapLibre basemap.
Prompts Used
ChatGPT: Used to research road-condition data sources, compare WZDx and TomTom, plan the first-person route view, troubleshoot WPC overlay alignment, and think through how road hazards should work with the route.
Cursor: Used to update the route view, implement road-condition data, preserve the existing routing system, and troubleshoot the MapLibre layers without breaking other working features.
What Worked
The route now feels much more like an actual navigation tool rather than just showing a line from point A to point B. The first-person route view makes it easier to follow while driving, and the user can still see the selected chase target and route information. I was also able to bring road-condition data onto the map and move toward a cleaner TomTom-based solution. The construction or road closure feature lets me click on specific areas to see what is affecting the road (road closed, construction, or blocked). TomTom also shows traffic flow so users can see where there is heavy traffic.
What Didn’t Work
The original WZDx construction/closure layer did not work well as the main solution. Coverage was inconsistent, and the combination of large point markers and road segments made the map too cluttered. So I continued to search for other methods of displaying road closures or construction while navigating.
Lessons Learned
The way information is displayed matters just as much as having the data. A full-route overview is useful for planning, but a first-person route view is much more practical while actively chasing. I also learned that an official dataset is not always the best fit if the coverage or display makes the feature harder to use.
Images/Video

The image using the WZDx dataset for road closures was way too cluttered.
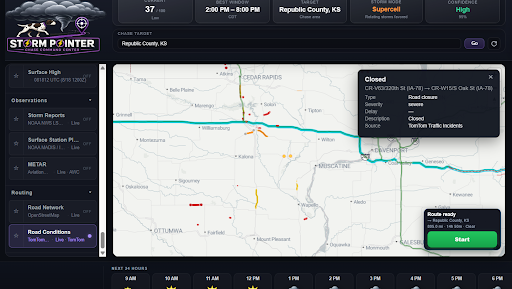
Image showing TomTom’s dataset. More road closures pop up as you zoom in, showing smaller ones or construction. Also shows the flow of traffic.

First-person point-of-view navigation while still displaying layers.