Since the 17th century, humanity has gleaned quantifiable insights into the happenings of our atmosphere near the surface. Torricelli inverted a mercury tube in 1643 and gave us the barometer, and the instruments that followed turned weather from something observed into something measured. Thomas Jefferson kept a near-daily record at Monticello, part of a tradition of surface observation that continues in the networks we depend on today.
Modern observational platforms support a vast array of use cases, including but certainly not limited to model initialization, aviation dispatch, utility load forecasting, irrigation scheduling, road treatment decisions, forensic meteorology, and insurance settlement. To support these applications, weather station siting must ensure observations accurately reflect the conditions they are intended to measure.
Weather Station Siting Standards
Given that these surface networks may inform platforms with far-reaching effects, weather station siting is critical. The WMO publishes the specification in WMO-No. 8, which classifies each site from Class 1 to Class 5, with each variable scored separately. Class 1 is reference grade, while Class 5 stations may contain considerable error.
The key principles of weather station siting include:
- Representative ground cover, meaning natural low vegetation rather than gravel or paving
- Standard instrument heights, which differ by variable
- Obstacles kept at a defined multiple of their own height
- An unobstructed horizon for radiation measurement
- Ledger of metadata covering every move, swap, and change to the site
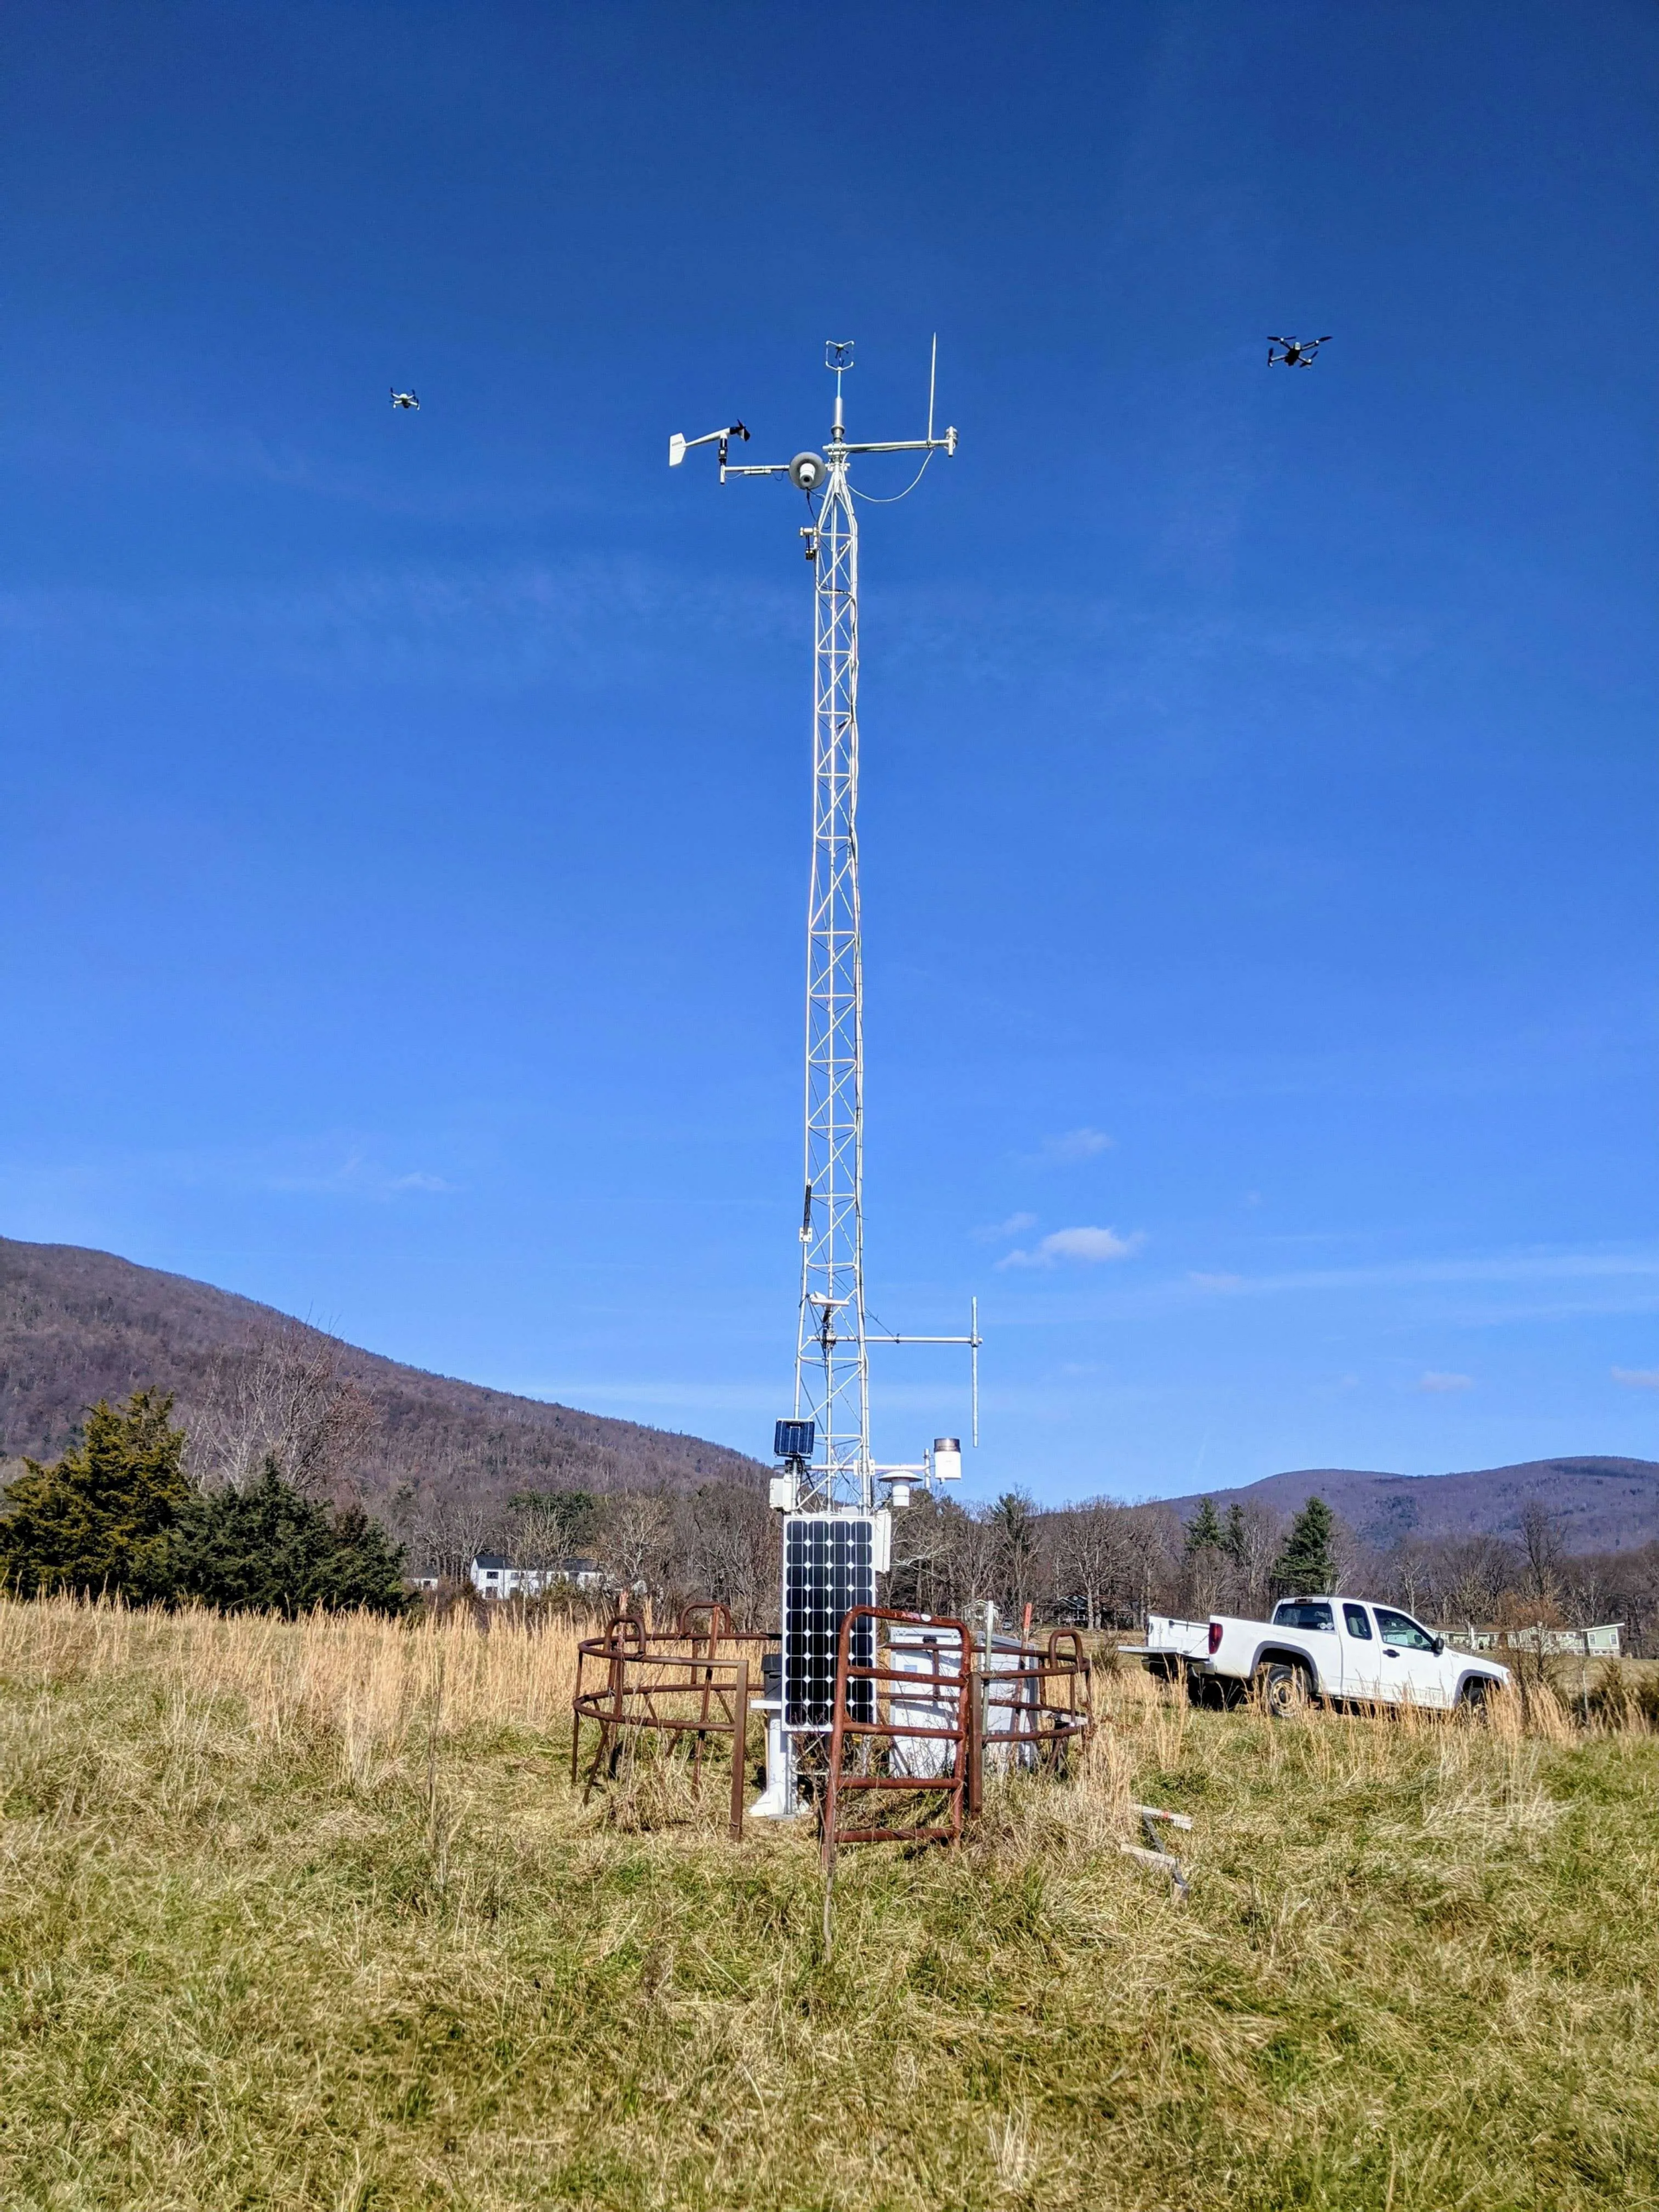
Image 1: A well-sited station with two drones at the same 10 m as the anemometers during a research campaign. The station has low vegetation around it and is free from nearby obstacles that could bias readings.
How Weather Stations Measure Meteorological Variables
Each variable has its own sensing method and siting requirements.
Precipitation. Tipping bucket gauges are a common method to measure liquid precipitation. Piezoelectric disdrometers are growing in popularity and measure the impact of raindrops to determine hydrometeor intensity and size. The biggest source of error is wind. Turbulence over the gauge deflects droplets before they land, so the gauge catches less than actually fell.
Temperature. A thermistor changes resistance with temperature and should sit inside a solar radiation shield at about 2 meters (roughly human head height). The heat capacity of surrounding surfaces might bias nightly temperatures, as surfaces like concrete may store heat through the day and release it after sunset.
Dew point and humidity. Capacitive hygrometers share the shield with the thermistor and measure moisture content within the air. Distance to the surface can confound these readings as evapotranspiration releases water vapor into the lower atmosphere. As such, these instruments should be properly aspirated (like thermistors) and placed sufficiently above the ground.
Wind. Cup-and-vane assemblies measure horizontal wind, while more expensive sonic anemometers can measure both horizontal and vertical wind. These anemometers should be placed sufficiently away from nearby obstructions and oriented to the north before data collection begins.
Solar radiation. Thermopile pyranometers measure the full shortwave spectrum, while silicon photodiode versions are cheaper, albeit spectrally limited. These instruments should ideally have a clear horizontal view while remaining away from any potential sources of shade.
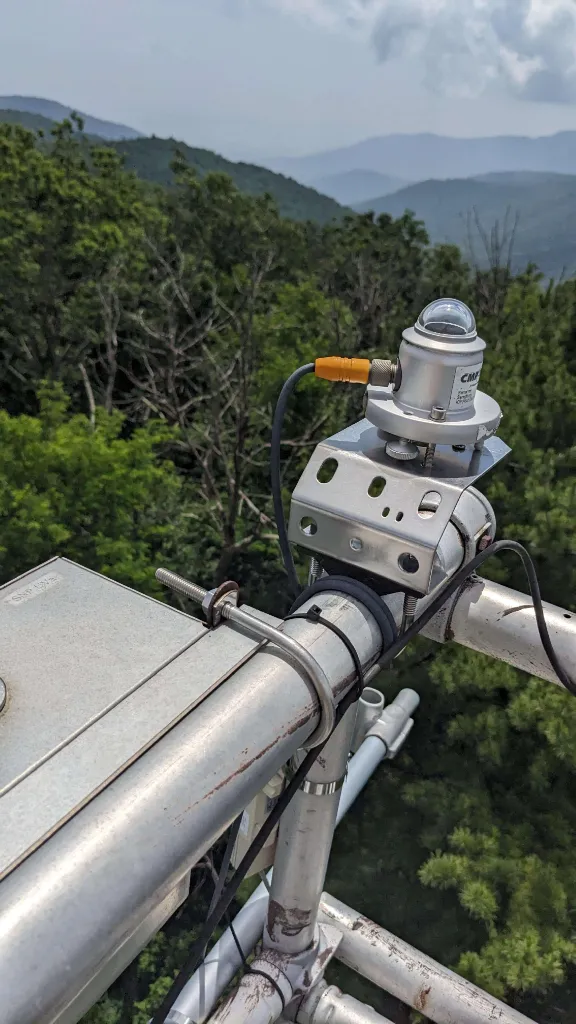
Image 2: A pyranometer within a meteorological tower in Central Virginia.
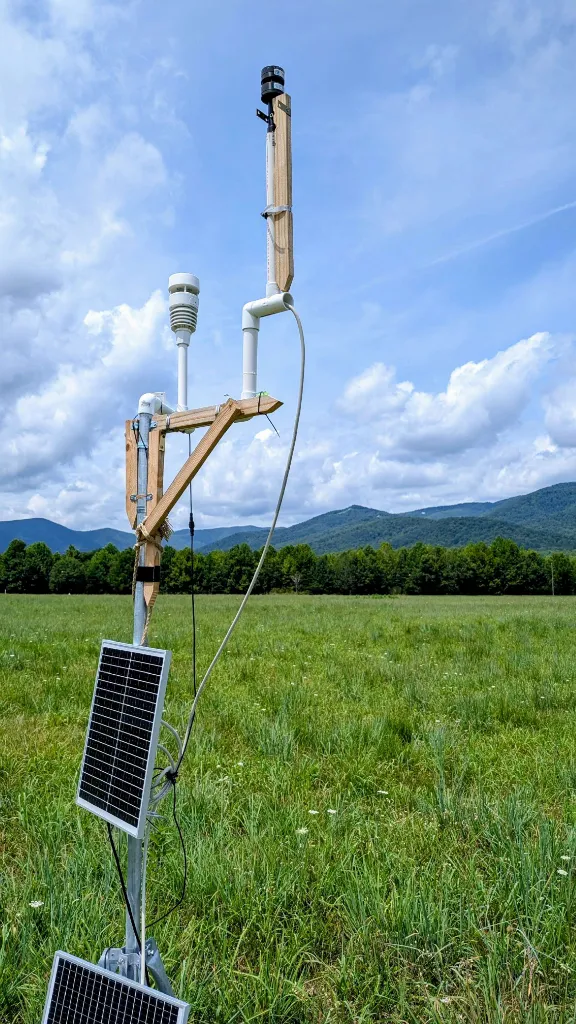
Image 3: A double weather station setup during a field campaign.
Common Weather Station Siting Mistakes
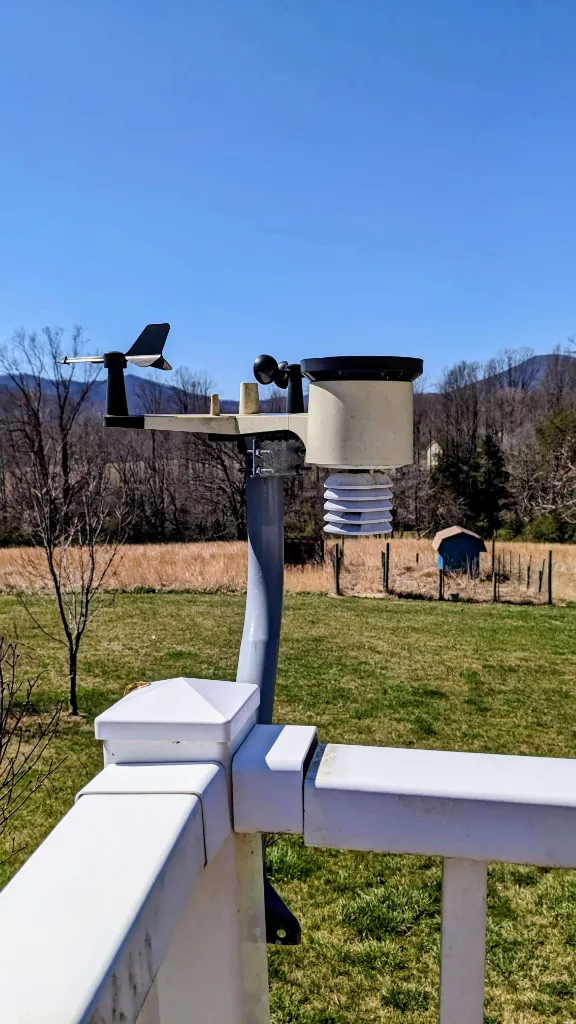
Image 4: This personal weather station was deployed on a patio with over 120° obstructed by a house.
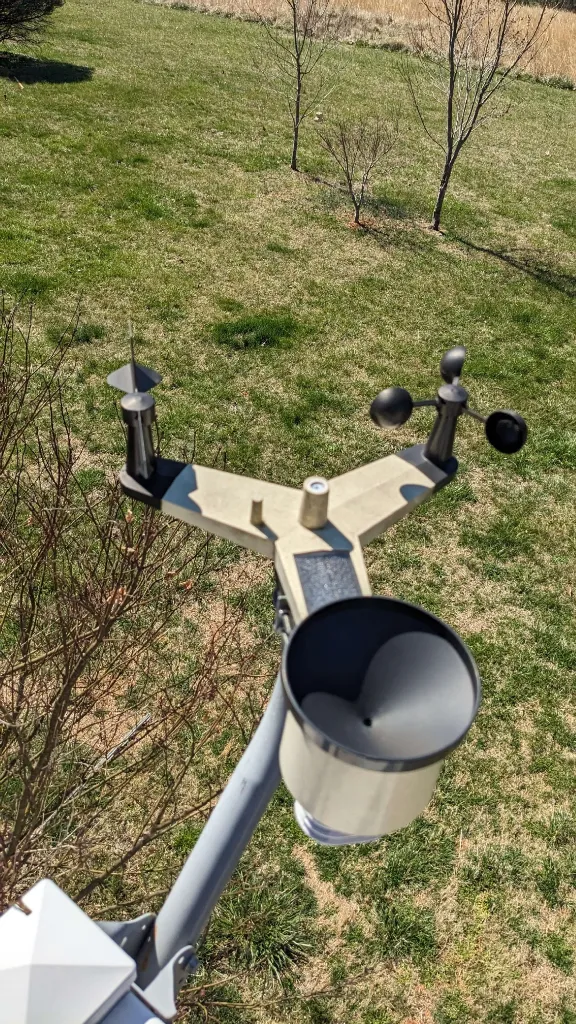
Image 5: The precipitation instrument includes a funnel and an inner tipping bucket.
Trees and buildings block momentum in some directions but not others, so wind speed reads low and the direction funnels through the gaps. They shade the pyranometer for part of the day and intercept precipitation before it reaches the gauge.
From the Ground to the Model
Surface observations do not stay at the surface. They, along with a vast observation network such as weather-balloon launches, feed into data assimilation that initializes models like the High-Resolution Rapid Refresh, which we ingest and display in Terrier at 3 km resolution.
So, the next time you are gifted a station and want to do the data justice, follow these weather station siting best practices so that your setup strives to reach the same level of siting professionalism as NOAA’s U.S. Climate Reference Network, which is freely available and remains the working example of siting done to standard.