

Terrier: Your Energetic Ally in Visualization
- Advanced weather data visualization library
- Stunning, interactive displays on the web and mobile
- Built for fast front-end display

Carrot Weather
Terrier Integrations
Leaflet JS
Integration:
– Provide stackName and Leaflet map
– Terrier integrates as a CanvasLayer for real-time rendering
– Handles reprojection, data sources, and timing automatically
– Delivers variable overlays directly on Leaflet maps
– Lightweight and reliable for web mapping

MapLibreJS
Integration:
– Provide stackName and MapLibre map
– Terrier integrates as a Custom Layer for WebGL rendering
– Controls layer placement within the map stack
– Showcases Terrier’s weather data layers on MapLibre maps
– Compatible with Mapbox JS toolkit features

ArcGIS
Integration:
– Provide stackName and ArcGIS Web map
– Terrier integrates via the Custom WebGL Layer interface
– Supports variable layers across ESRI mapping environments
– Maintains performance and interactivity with large datasets
– Seamlessly extends ArcGIS map capabilities

OpenLayers
Integration:
– Provide stackName and OpenLayers map
– Supports Terrier’s variable layers via canvas shim
– Matches OpenLayers projection matrix for 100% alignment
– Handles animations and weather timing seamlessly
– Efficient rendering with independent layer management

Mapbox
Integration:
– Provide stackName and Mapbox map
– Terrier integrates as a Custom Layer for real-time rendering
– Leverages Mapbox’s high-performance rendering
– Optimized for mobile platforms
– Delivers premium map quality paired with professional weather visualization

White Papers

Terrier Blog Posts
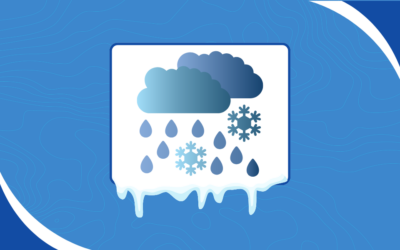
How Mixed Precipitation Types Form in Winter Storms
Winter storms often produce mixed precipitation types rather than sticking to a single form. Some of the most impactful events bring a messy combination of rain, freezing rain, sleet, and snow, sometimes all within a few miles of each other. Understanding how and why...
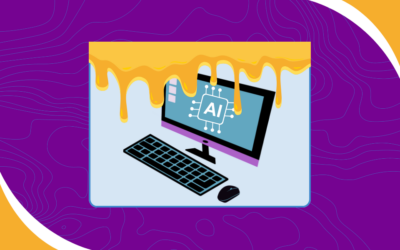
Sorting Signal from Slop in AI Code in Open-Source Projects
With technology, I've learned to just see what happens. There are several dumb ideas, like NodeJS, Python, and the iPad, that I was just completely wrong about. So when I started watching AI code in open-source projects, I hoped for the best. After all, I grew to love...
Why Terrier May Be Better Than A Web Map for Real-Time Weather Visualization
Terrier is our display toolkit for animated weather data. It's a real-time WebGL JavaScript toolkit that our users can integrate into their MapLibre/Mapbox, OpenLayers, ESRI Map SDK, or Leaflet maps. We went to a lot of trouble to build it, and it's worth talking...
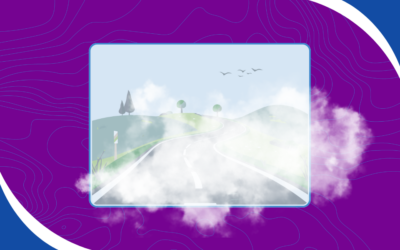
When Visibility Matters, Fog Visualization Makes the Difference
Fog is one of the most common and underestimated weather hazards. It forms quietly, spreads quickly, and can dramatically reduce visibility with little warning. Effective fog visualization helps bridge that gap by showing where low-level clouds are forming, how...
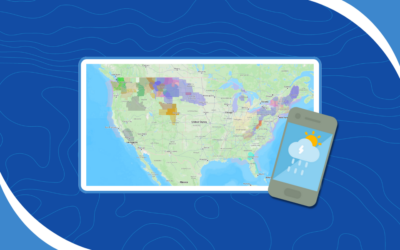
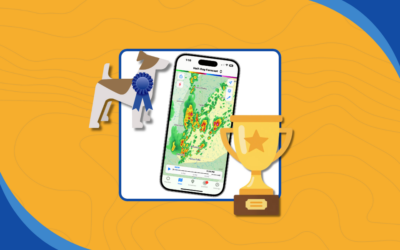
Introducing Our New WWA Weather Data Pipeline
We are delighted to announce we've added National Weather Service Warnings, Watches, and Alerts to our products, and this update introduces our new focus on WWA weather data.The initial integration is with Terrier for Mobile, and the screenshot above is from an iPad...
Making Winter Easier With Better Winter Weather Data
Winter weather always finds a way to surprise people, which is precisely why winter weather data matters so much this time of year. Operations teams say the same thing every winter. The models look solid, the setup seems clear, then the real world shifts. A degree or...
Industries
Automotive
Aviation
Consumer
Utilities
Have a project in mind?
Our weather data platform handles everything from standard datasets to custom data, whether purchased or generated in-house. Customers can have their own Boxer stack with access to Terrier front-end tools, and we provide full support for processing, transforming, and delivering weather information efficiently. Customization is where our expertise shines, helping you get exactly the weather insights you need. Let’s work together to bring your next weather data project to life!