Goal
My goal for the week was to keep building out the Storm Chaser dashboard and get the major pieces working together. I want the Wet Dog Weather data to display correctly (which I finally accomplished!), the animation timeline to work as intended (which I did), and the routing section to start and feel more like an actual GPS tool rather than just a basic map feature. I also want to continue improving how the user can interact with SPC outlook areas and start thinking about how traffic, construction, storm type, and route safety could eventually be added.
Workflow
I used ChatGPT to help me think through the next steps. I stopped using ChatGPT for prompt writing as it seemed to overcomplicate things. I used Cursor to make the actual code changes. I found it easier to upload screenshots of the issues I was having with the dashboard and to keep my prompt simple. For example, “the legend isn’t showing; I want it on the left side, small, and it must match wet dog weather.” I then uploaded the images (my dashboard and the Wet Dog Weather dashboard) with the prompt.
My process was usually to work on one feature, test it in the browser, and then fix whatever broke before moving forward. This week, the biggest issue was the routing section. Once I had the Wet Dog Weather data displaying correctly, I started building out the route feature so the user could click on an area and navigate to it. The routing part started working well, but it broke the Wet Dog Weather display. I decided to finish the route functionality first, then go back and repair the Wet Dog Weather integration so both could work together.
I also spent time getting the animation timeline exactly where I wanted it and how I wanted it to look. I worked on the play and pause controls, the timeline display, and making sure the weather data could animate properly. After that, I continued testing the SPC Convective Outlook overlay and the routing behavior. I can now click inside an outlook area, including an Enhanced Risk area, select a location, press Start, and get navigation from my exact location to the selected point. The dashboard does prompt for permission to use the user’s location.
Prompts Used
I explained to ChatGPT what I got done and what I should focus on next. I would also send ChatGPT screenshots for suggestions on how it should look or how it should function.
For Cursor, I would tell it fix the Wet Dog Weather display and animation after routing changes affected the map, make it so the route section connected to the user’s exact location, allow users to click a point inside an SPC Convective Outlook area and start navigation to that location, improve the animation timeline so it didn’t alter the whole dashboard and keep it within the map, not outside of it, same with the legend. I had it begin preparing the dashboard for traffic, construction, and storm-type information.
What Worked
A lot worked this week. The Wet Dog Weather data is now displaying correctly, and the animation timeline is working as I intended. The route section is also working and looks really good. I can click on a location within an SPC Convective Outlook area, including an Enhanced Risk area, press Start, and the dashboard creates a route from my exact location to the selected point.
The map legends also appear correctly, making the active layers much easier to understand. The dashboard is starting to feel like a single, cohesive tool rather than several separate features. I am VERY happy that the Wet Dog Weather data, the SPC outlook overlays, the timeline, and the route system are now working together.
I also started looking into how traffic and road construction could be displayed, as well as how the dashboard could identify the type of storm. Those parts are not complete yet, but I have started figuring out how they could fit into the application.
What Didn’t Work
The biggest issue was that adding the route feature broke the Wet Dog Weather display. The routing section and the weather layers were both interacting with the same map, so changes made for one feature affected the other. I had to finish the routing work, then go back and fix the Wet Dog Weather side so both systems could run together without interfering.
I’m still unsure how difficult it will be to take the routing feature further. I want the dashboard to do more than navigate to a selected point. I want it to eventually tell the user which side of the storm may be best for viewing or intercepting, warn them about unsafe approach directions, and suggest alternate routes if traffic, construction, or storm movement makes the original route unsafe. I have not fully figured out how to build that yet. Traffic, construction, and automatic storm-type identification are also still in the early stages. I have started looking into them, but they are not fully functional.
Lessons Learned
This week, I learned how easy it is for one working feature to affect another when both use the same map and application state. The routing section worked, but it unintentionally broke the Wet Dog Weather display, so I had to go back and make sure both parts could work together. It reminded me that getting a single feature to work on its own is not enough. I also have to test how it affects everything else that is already functioning. Each feature needs to share information without breaking the others.
I am really excited about how it looks and how much progress I have made. I feel like I am getting much closer to the end goal!
Images/Video
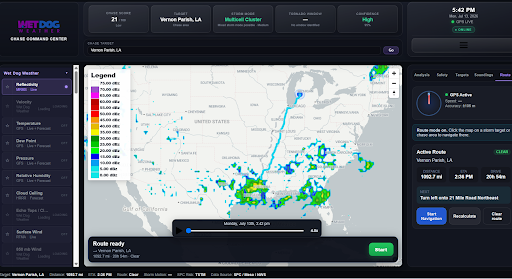
Image 1: Terrier working with the route planning functional.
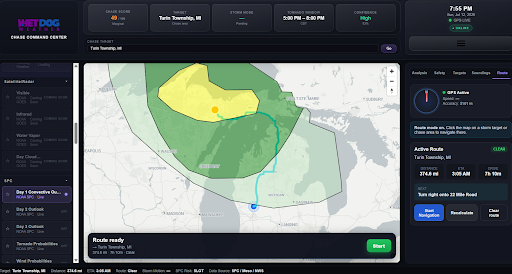
Image 2: Route function working with SPC convective outlook. Storm mode is still not working.
Image 3: Wet Dog Weather breaking after the routing function was working.
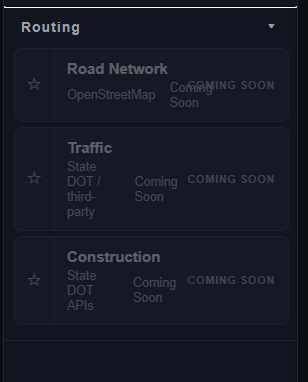
Image 4: Routing function shown not working once Wet Dog Weather data was working.