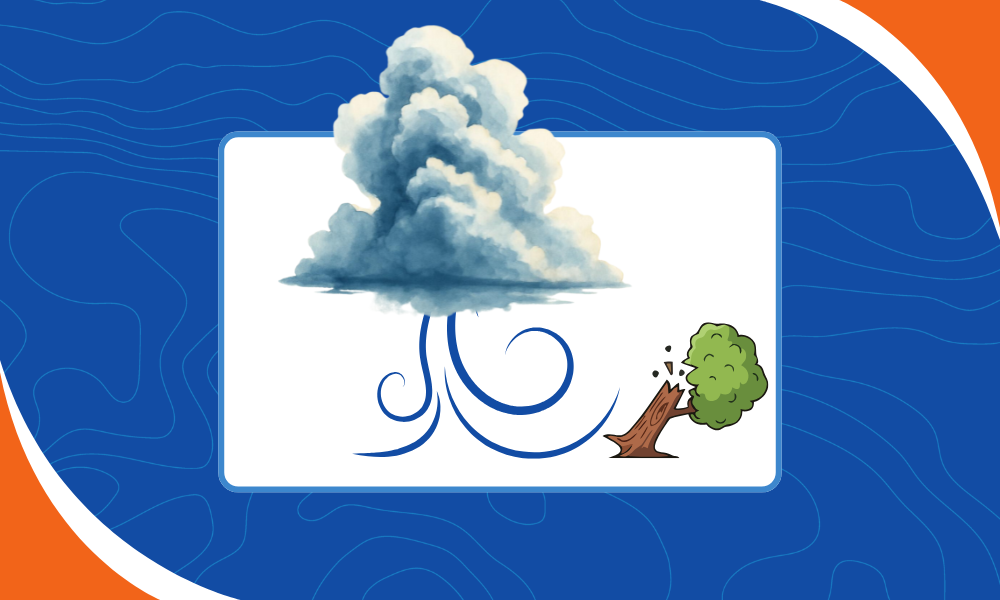
Clouds move in accordance with Earth’s gravity, and as a result, powerful and interesting phenomena often arise. In this blog post, we will unpack the processes behind damaging thunderstorm winds. In particular: downdrafts, micro- and macrobursts, and squall lines. The latter of these we may see as line echo wave pattern (LEWP) radar signatures. We took apart the big whirls in our global patterns post. This one is about the little-but-mighty whirls, the ones that snap trees.
The anatomy of a multicellular convective system is shown in Figure 1.
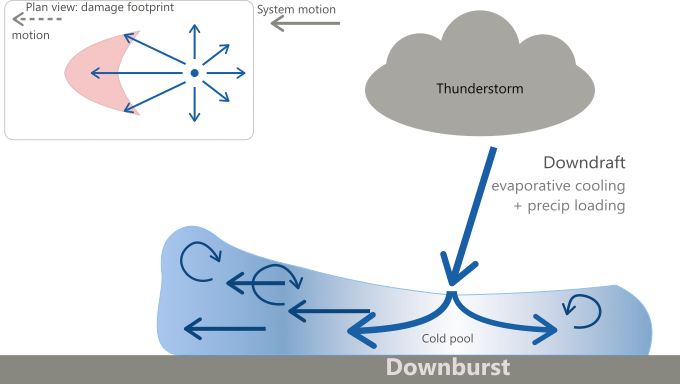
Figure 1: downdraft to downburst to gust front, with an overhead-view inset of the damage footprint.
From Downdrafts to Downbursts
As the strong updraft core continues to fuel vertical storm development, enhanced turbulent mixing promotes collision-coalescence processes. While cloud droplets continually congregate, ever-larger water droplets form. Eventually, these suspended hydrometeors begin to fall, and when they do so in sufficient concentration, a strong downdraft may follow. Falling rain drags air down with it, and as it evaporates on the way, it chills that air and makes it denser still.
Video courtesy of Jerrod Harris on Vimeo
If the column hits hard enough to do damage at the surface, it gets its own name: a downburst. These downbursts are among the most destructive damaging thunderstorm winds, producing localized areas of intense wind damage. Fujita (of the tornado scale) coined the term in the 1970s while digging into airliner crashes. When the damaging outflow is less than 4 km, it’s a microburst; anything larger and longer-lived is a macroburst. The smaller, more concentrated microbursts are usually more violent, with winds up to 168 mph.
The Surface Impact of Damaging Thunderstorm Winds
The surface spread of the downdraft as it meets the earth is schematized in the inset of Figure 1. On impact, the outflow rolls up into a vortex ring, like a smoke ring flattening against a table, and the strongest winds ride under that ring. The storm’s lateral velocity and the downdraft shaft’s orientation determine the region with the strongest winds. These sudden events are challenging for local trees and flora because they may bring about winds the trees did not grow to withstand, as was the case for the tree shown in Figure 2.
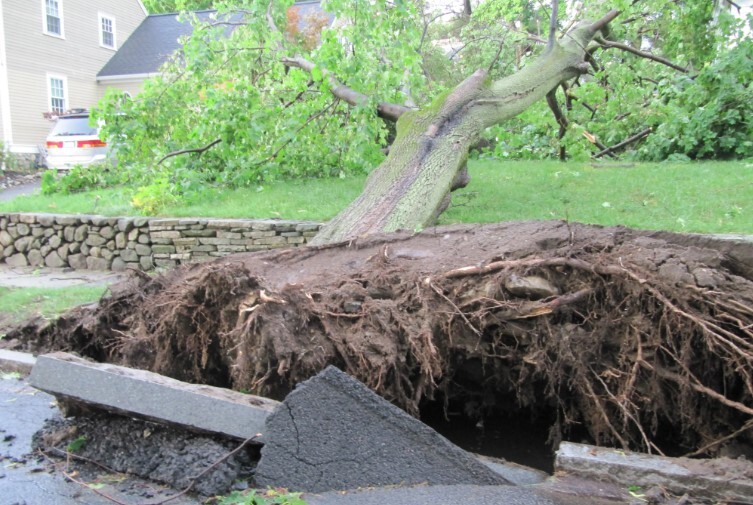
Figure 2. A tree knocked over in Melrose, Massachusetts, by a macroburst in 2010.
The cold air then spreads along the ground. Its leading edge, the gust front, works like a mini cold front, shoveling warm air upward as it goes. That lift also has the potential to fire off the next round of storms by providing the lifting mechanism for air parcels to reach their condensation level.
Along the Squall Line
Now let’s scale it up. When a whole cluster of storms punches down and surges out at once, and those individual gust fronts merge into one continuous leading edge, a squall line may form. This band of thunderstorms usually plows just in front of a cold front.
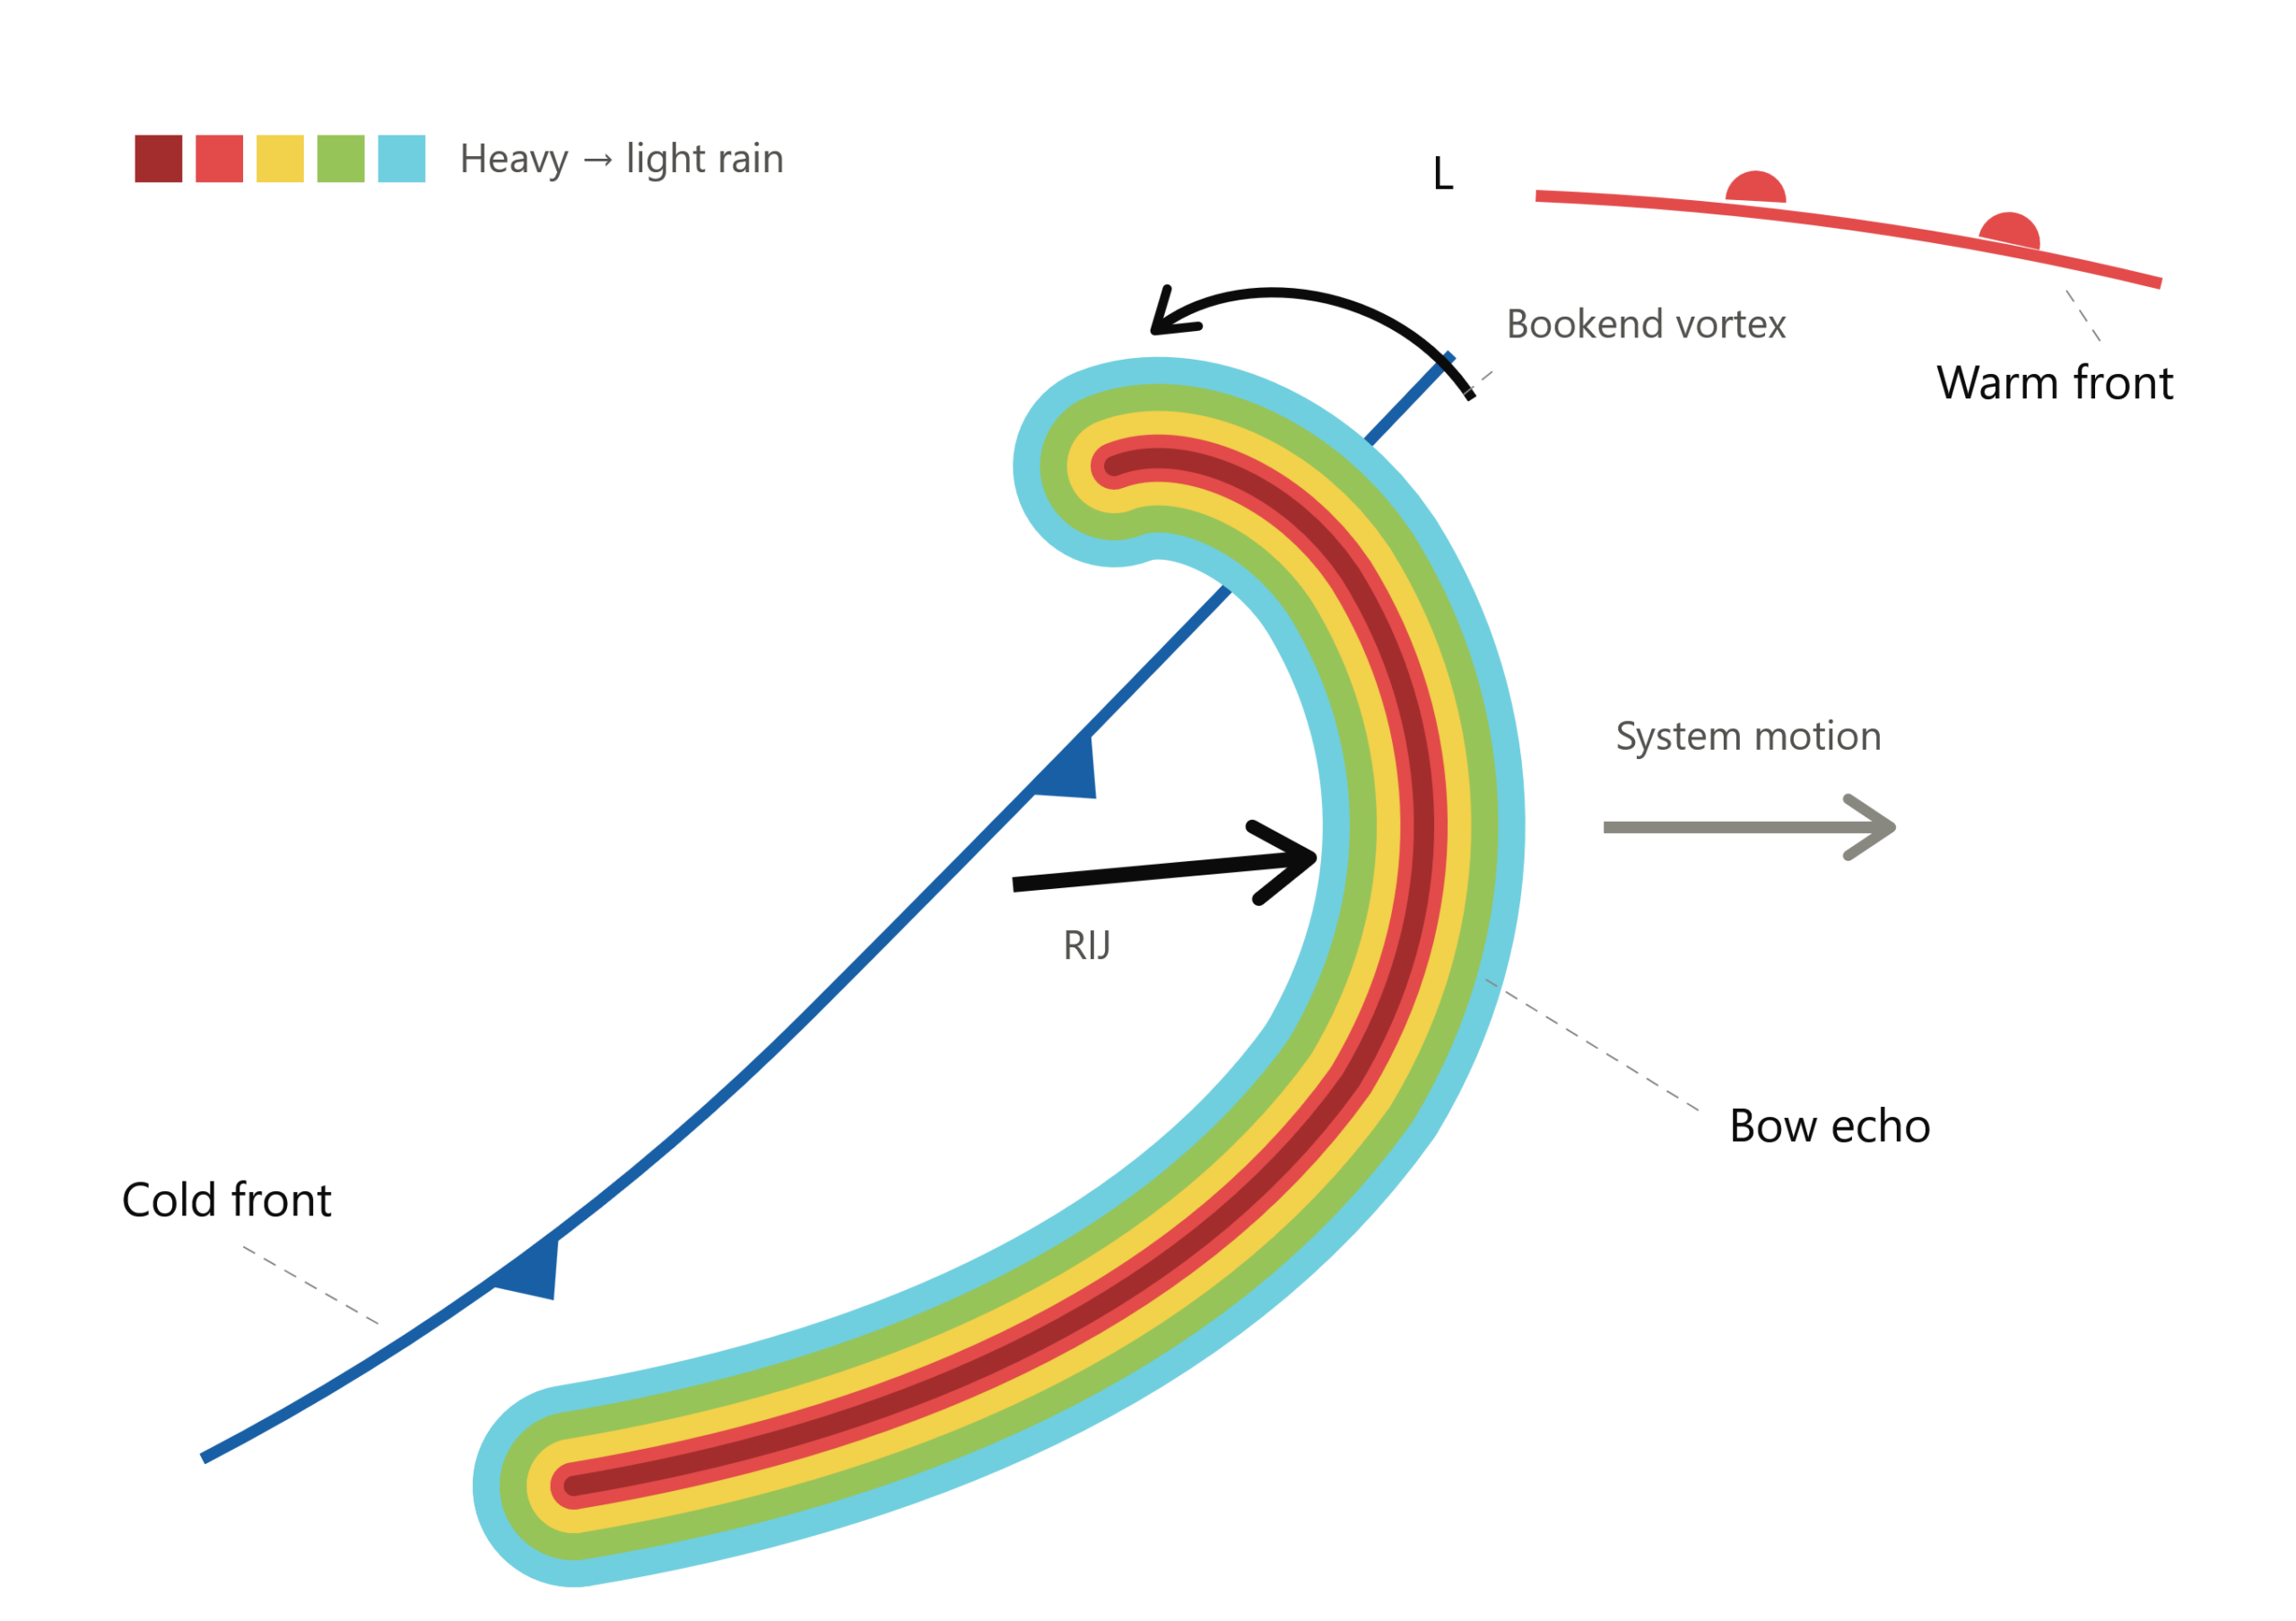
Figure 3: a bowing squall line ahead of a cold front, with rear-inflow jet (RIJ) and bookend vortex.
A rear inflow jet of often colder, drier air drives into the back of the line, accelerating its downdrafts. The merged cold pool then slices beneath existing moister, warmer air and lifts this air mass upward. As the water vapor in this air reaches its condensation level (usually around 1 km AGL), the continued formation of thunderstorms may persist in a bowing pattern. That’s the bow echo. String a few bows along one line, and you get the line echo wave pattern (LEWP) mentioned within the intro. If the atmosphere keeps one going for hundreds of miles, it may graduate to a derecho.
Visualizing Damaging Thunderstorm Winds
Radar provides one of the best ways to identify damaging thunderstorm winds before they arrive. A squall line appears as a bright, continuous band. The bow is the segment bulging toward you (Figure 3), and the outflow boundary runs out ahead as a faint, fine line. Being able to read the bow echo signature from an approaching system may provide crucial time to prepare for a strong gust. How many of these a season serves up shifts with the large-scale synoptic steering, as we covered while tracking El Niño.
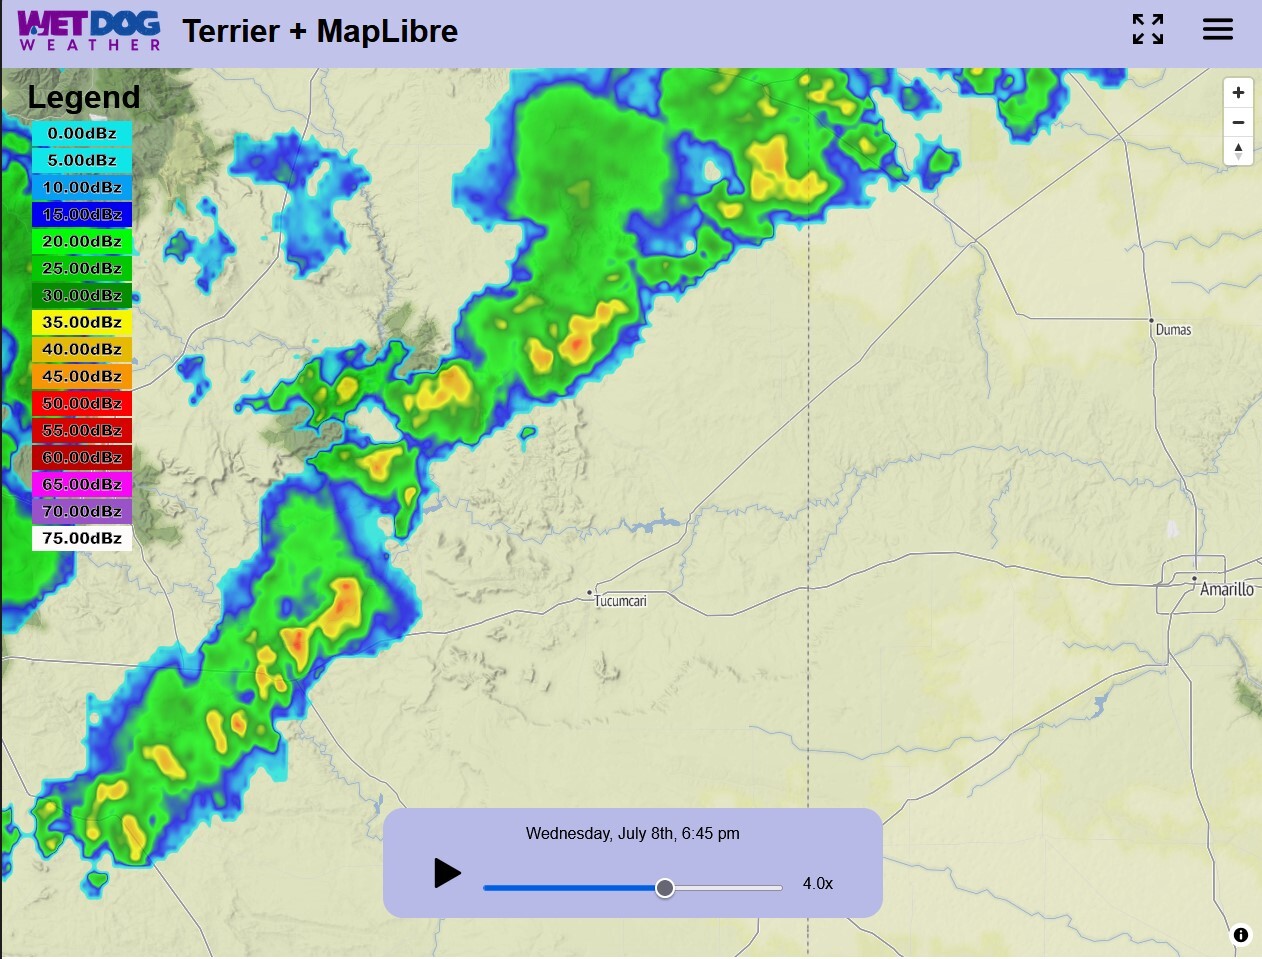
Figure 4: Reflectivity product visualized within Terrier, showcasing a coherent system rolling over the face of New Mexico.
Our reflectivity product drops straight onto a web map (Figure 4), and future advective radar attempts to advance this line in time relative to the system’s velocity. Worth a look before the next storm shows up on your horizon!
Putting It All Together
Damaging thunderstorm winds can develop on scales ranging from localized microbursts to long-lived squall lines, producing widespread damage. Understanding the processes behind these events and recognizing their signatures in radar imagery can help you better interpret approaching storms. Whether you’re tracking an isolated downburst or a fast-moving bow echo, Terrier’s reflectivity and future advective radar products help bring these evolving systems into clearer view.