Although we don’t use traditional version numbers, we’ve made some significant updates to Boxer, leading to a suite of Terrier enhancements we call Terrier 2. These enhancements introduce powerful new features that allow users to filter, select, and display data with unparalleled control.

We’ve been busily adding data sets and variables for our customers; frankly, it’s getting out of hand. No one has access to everything, of course, since customers make their own deals for data. But it’s getting to be a lot of data for the more complicated users, which necessitated some new functionality in Terrier.
Terrier Enhancements: Enhanced Selection Options
Displaying all available “2m temperature” data for a given time loses utility when you have dozens of overlapping or conflicting data sources. While Terrier can display them all if needed, that’s more of a technical feat than a practical solution. We needed to empower developers with refined filtering options, leading to the Terrier enhancements in Terrier 2.
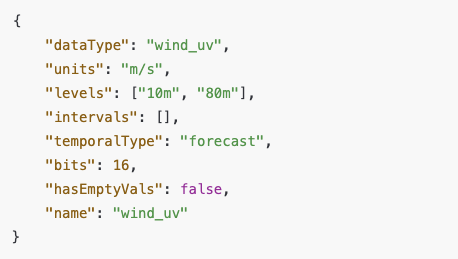
Our answer was to shift some intelligence from Terrier over to Boxer. Now, Terrier 2 queries Boxer for a complete list of available data in a given Boxer stack, receiving responses with metadata like this:

This sample describes a GFS entry for wind velocity. At startup, Terrier fetches this metadata from Boxer, including source model, product, and region details, allowing either Terrier or the developer to make informed display decisions.
New Selection Features
If you ask Terrier to display “temperature,” it defaults to “2m temperature” and displays all data available. Now, however, you can specify much more. Terrier 2 provides bounding boxes for each source region, from familiar areas like “conus” and “alaska” to more obscure ones like “newyork-1.” You can check these bounding boxes yourself or have Terrier handle it.
Using the sourcesForVariable() method, you can input search constraints. Terrier will return a list of relevant source/region/product/variable combinations for display. For example, if you request radar reflectivity data over the continental US, Terrier returns the ‘mbr’ (base reflectivity) for the CONUS region. If you want ‘mcr’ (composite reflectivity) instead, add it as a product constraint. Terrier will return ‘mcr’ for CONUS, excluding regions like Alaska or Hawaii unless specified.
If you prefer, you can sort through our sources manually, passing custom lists to Layer creation to fit your needs. We recommend starting with sourcesForVariable() and adjusting results in your code.
Terrier Enhancements: Display Options and Color Mapping
We’ve added a bunch of new radar variables—which we really should post about—but for now, they’re in the new Boxer stacks. We’ve also added color maps for many of those new variables and some of our old ones.
We’ve added numerous radar variables—which we’ll highlight in an upcoming post—to the new Boxer stacks, along with new color maps for both new and existing variables. Access these directly in the Terrier library or use the colorMapForVariable() method, which selects a suitable color map based on the data type or variable name or gives you a default one as a placeholder.
New color maps include Precipitation Flags, Hail Size, and many others.
If you’re a customer, take a look at our Dashboard’s React JavaScript app in the Terrier repo to try out these new Terrier enhancements.
Summary of Terrier Enhancements
With the new Terrier enhancements in Terrier 2, we’ve equipped developers with fine-grained control over data selection and display, addressing the complexity of our expanded datasets. Whether filtering specific radar data or selecting custom color maps, Terrier’s capabilities are now more powerful and user-driven than ever.

