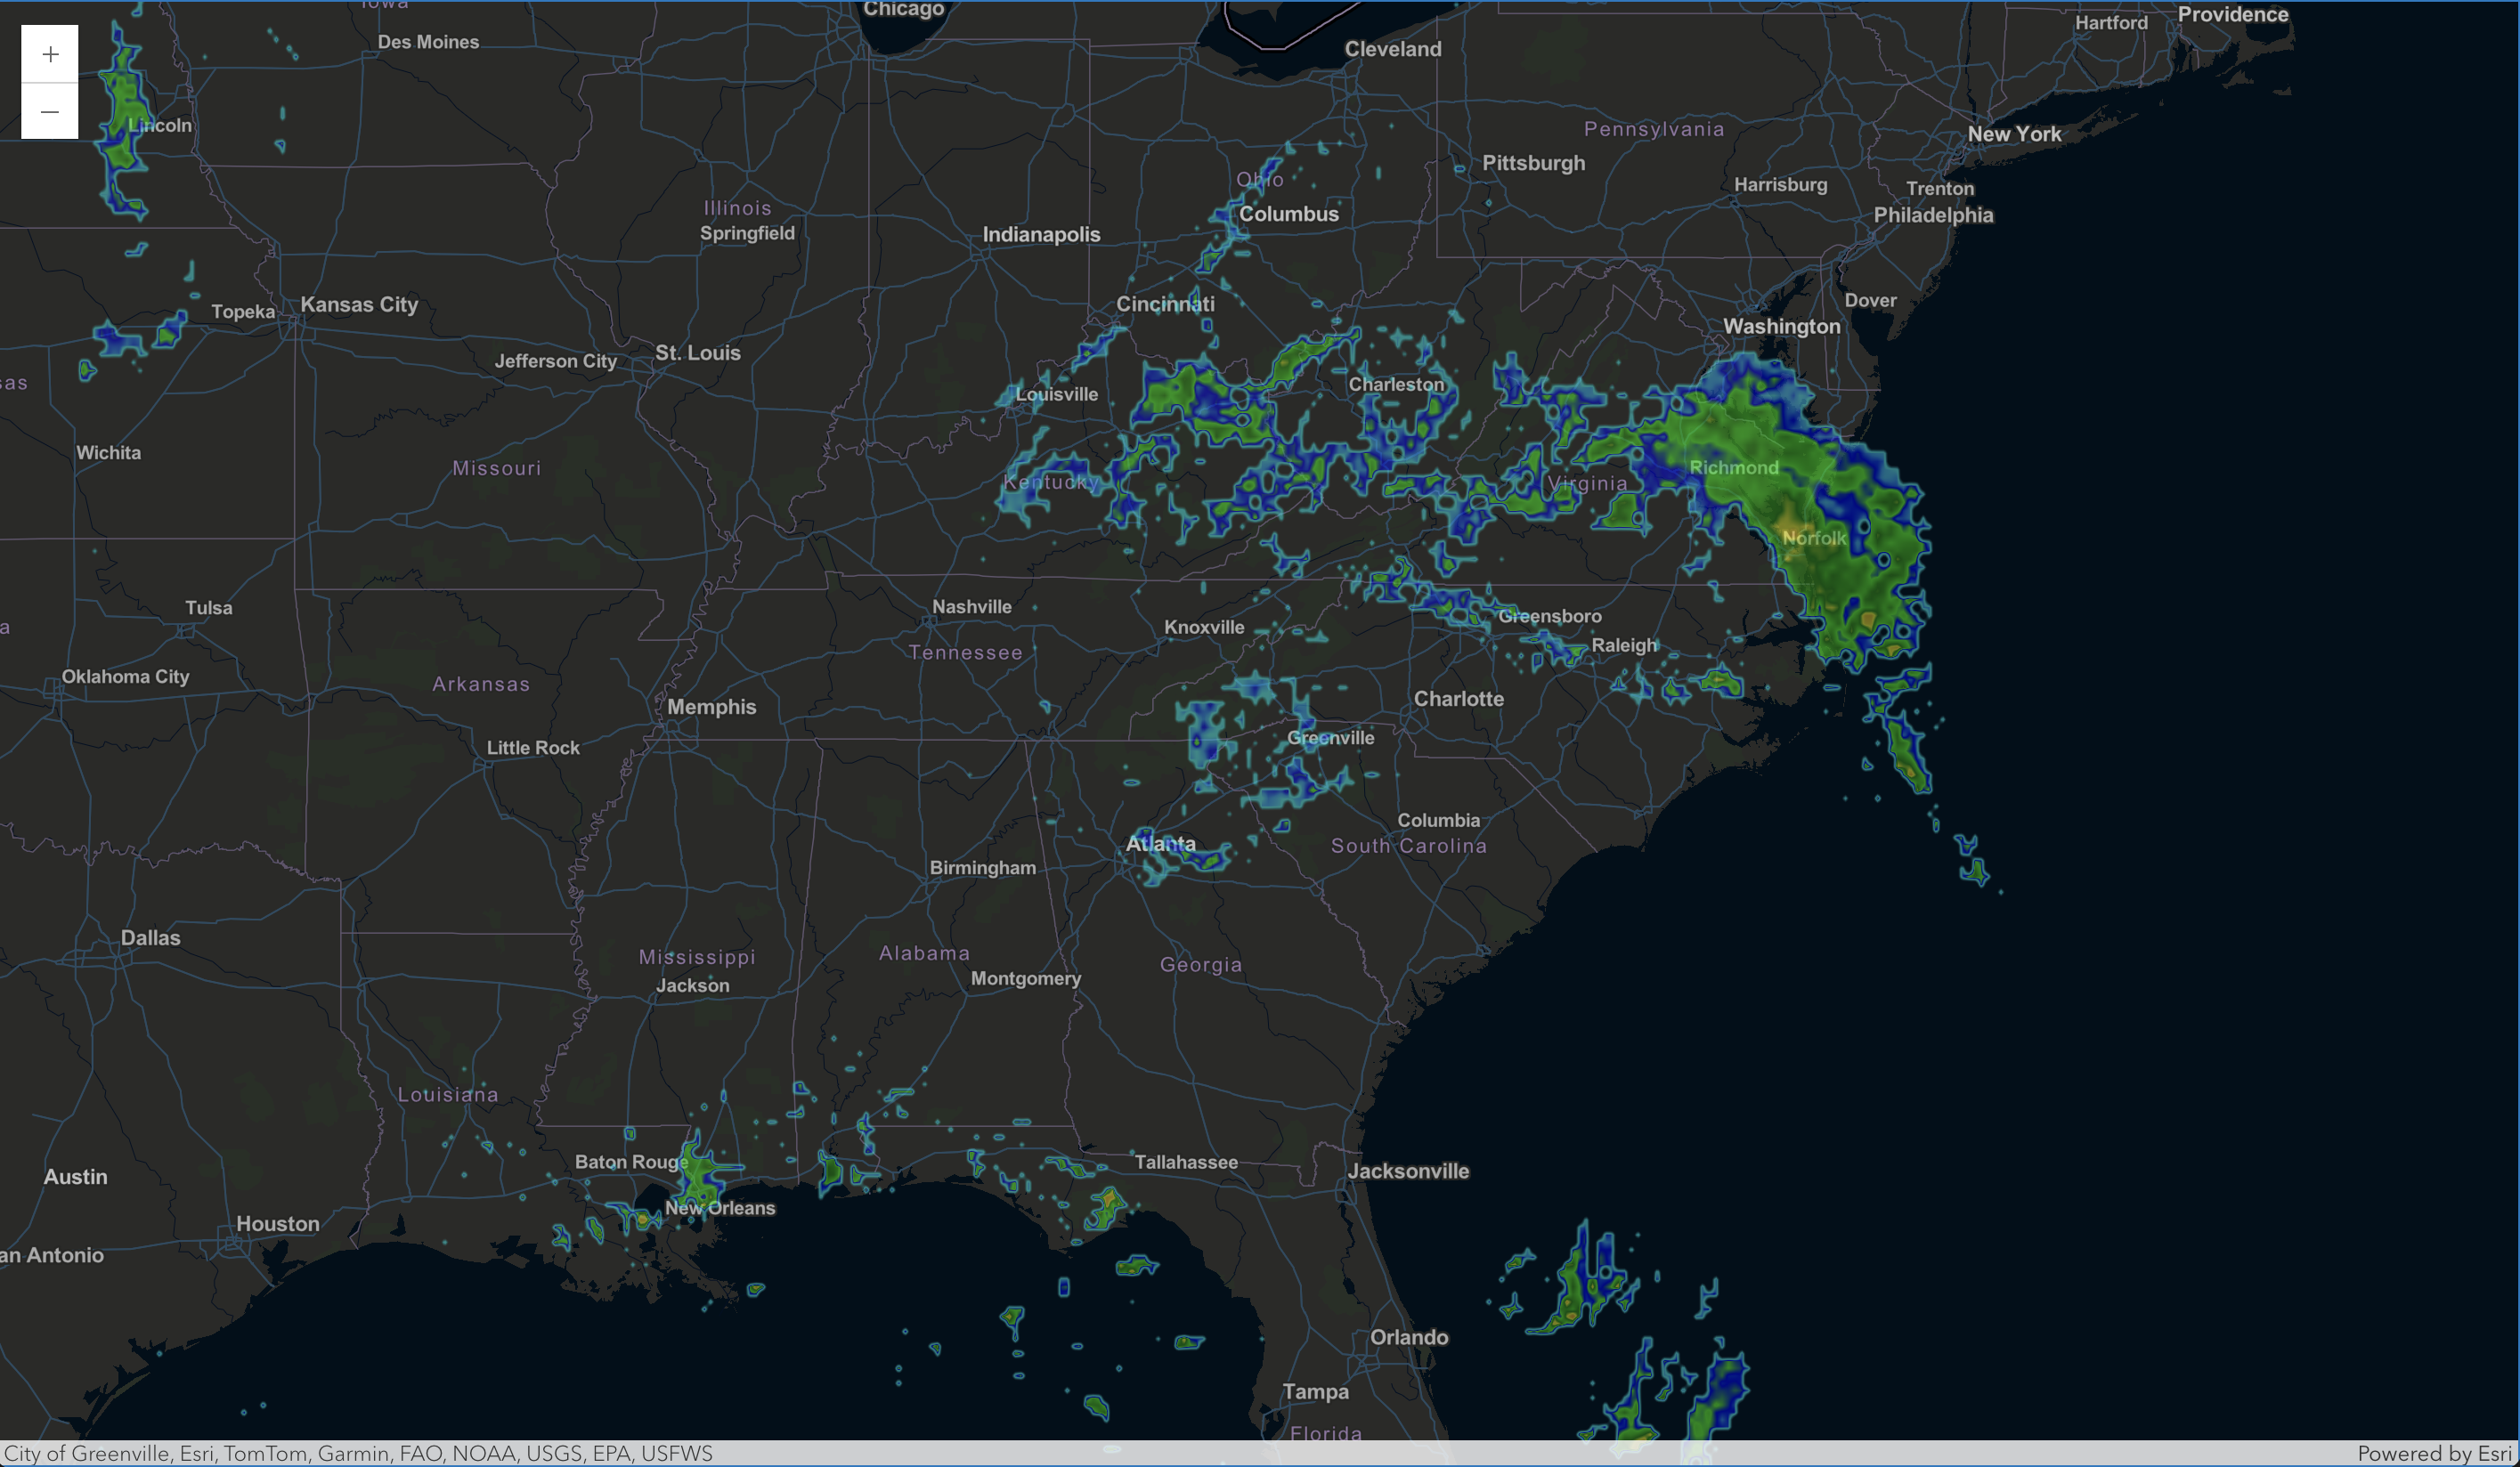
We’re excited to announce our latest enhancement: ArcGIS Maps SDK integration for weather data visualization. This new feature brings the power of Wet Dog Weather’s Terrier product to users of the ArcGIS ecosystem. Now, displaying real-time weather data on your ArcGIS maps is as straightforward as our other map integrations. After setting up your map with a simple integration call, you can leverage Terrier’s comprehensive weather visualization capabilities within your ArcGIS-powered applications.
You may come at this blog post from different directions, so let’s start with the basics.
Who is Wet Dog Weather and What is Terrier?
We are Wet Dog Weather, a weather data visualization company. Our Terrier product displays real-time weather data in all its beautiful bounty on the web or mobile.
We’re talking about the web here, and though Terrier is a map product, it does not display its own map. It shows on top of other maps, including MapLibre, MapboxGL, Leaflet, and now ArcGIS Maps SDK.
We display real-time weather data and now support ArcGIS Maps SDK. If you’re part of the ESRI ecosystem, this will make sense. But if you’re not, here’s a bit more explanation.
What is ArcGIS Maps SDK for Javascript?
ESRI is a huge company in the commercial GIS space. It’s used by many cities, states, governments, and private companies for GIS data management, display, and other purposes. If you’re familiar with open source, QGIS competes with some of its product lines.
ESRI makes various products using the ArcGIS name. The one we’re integrated with is their web display SDK. It displays data from ESRI’s systems and other data sources, including us. If you’re from the open-source world, an equivalent would be MapLibreJS.
How ArcGIS Integration Works
Like our other integrations, this one is straightforward to use. Set up your ArcGIS map as usual, then call Terrier to do the rest of the integration—in Javascript.

Once integrated, you can start a Terrier layer to display your data. We provide layers like temperature, radar, wind, pressure, and many others. You can apply your own colormaps, control how they’re displayed, set the time, animate over time, and have a host of other features.
As in the other integrations, you can access any data in your stack. We take care of the rendering.
Thoughts on ArcGIS Maps SDK for Javascript
ArcGIS Maps SDK for Javascript is pretty good! Most of the commonly used map toolkits are map first. They display a map, and you can decorate your own data on top if you insist. But really, they’re trying to display that map, and you’re along for the ride.
Some, like MapLibre and MapboxGL, are decent at adding your data. Some are less so, but I won’t name names. The ArcGIS Maps SDK is one of the most pleasant I’ve encountered.
It makes sense why. ESRI is a GIS company, not a map company. They are not trying to display a One True Map, just big piles of data they want their customers to get in front of their users. Thus, you expect more flexibility in their tools and the Maps SDK delivers.
We started supporting Web Mercator and a reasonably simple display for our initial integration. Over time, we can add more as needed. Terrier can support multiple map projections and interact with the more interactive features of the Maps SDK. We’ll see if users need them.
Advancing Weather Visualization in the ESRI Ecosystem
Integrating Terrier with ArcGIS Maps SDK for Javascript is a significant milestone in weather data visualization for the ESRI ecosystem. This collaboration brings together advanced meteorological data and ArcGIS’s robust GIS capabilities, allowing organizations to seamlessly incorporate real-time weather layers into their applications for enhanced decision-making across various sectors.
This integration is just the beginning, and we’re excited to see how users will leverage this capability to create innovative solutions and gain deeper insights from their weather and GIS data.
Stay tuned for more updates, and don’t hesitate to reach out if you have any questions or need assistance with the integration. Together, let’s continue to push the boundaries of what’s possible in weather data visualization and GIS technology.

