Transforming Weather Data Into Valuable Insights

Transforming Weather Data Into Valuable Insights

Access It
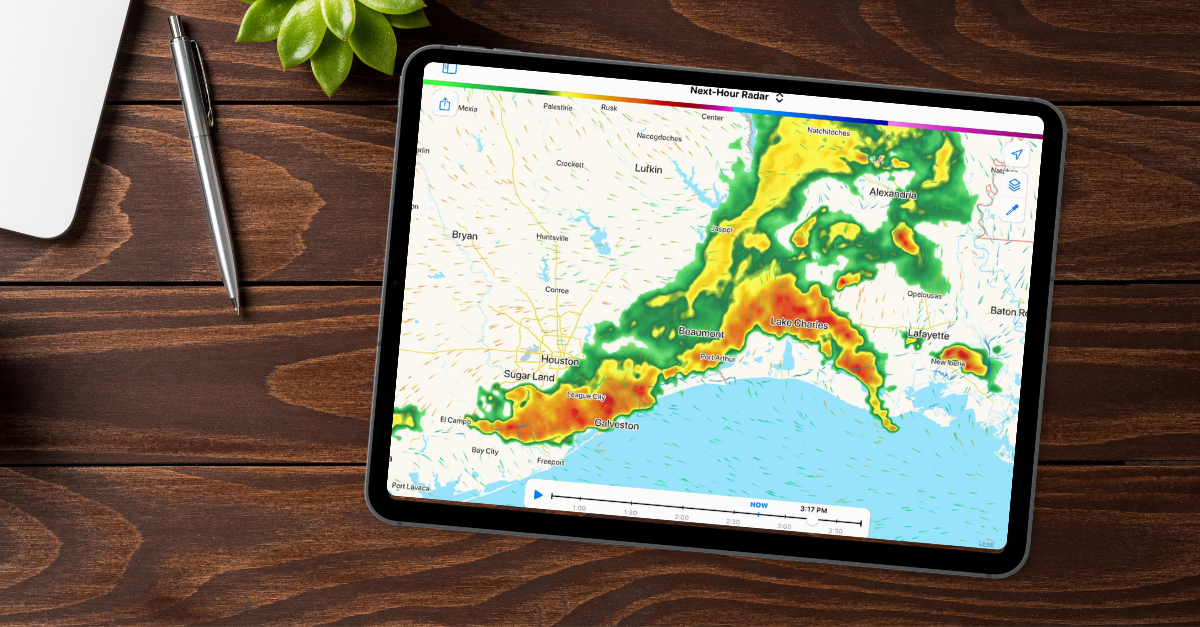
Our platform delivers fast, reliable access to weather data and visualization for web, mobile, and enterprise applications.

Transform It
Ingest data from models, observations, or custom sources, then standardize and transform it into formats that fit your workflows.

Make It Yours
We configure the platform to process your unique datasets, creating consistent, ready-to-use weather data tailored to your needs.
What We Do
We help teams work confidently with weather data. Our weather data platform supports decision-making, application development, and operational workflows by turning complex weather information into something teams can trust and use.
What We Build
Wet Dog Weather builds a weather data platform that helps teams ingest, standardize, and transform complex weather and sensor data into fast, reliable datasets. Our platform integrates models, observations, and partner data into a single, consistent system, making it easy to query, analyze, and visualize weather information across applications.

Element Weather

Flash Weather AI
The Wet Dog Weather Pack of products supports the full lifecycle of weather data, from raw ingestion through transformation, retrieval, and visualization. Everything is designed to scale securely and support real-world workflows, whether you are building internal tools, customer-facing products, or operational decision systems.
How It Works

We start by ingesting weather data from public sources, proprietary models, and partner datasets, then standardize and transform it into consistent, performance-optimized forms. Once data is in the platform, teams can quickly query it, apply transformations, and deliver it to applications, dashboards, or downstream systems.
Because the platform works the same way across all data sources, integration stays predictable and efficient. Whether you are working on web, mobile, or enterprise systems, Wet Dog Weather provides a single, reliable foundation that carries weather data from ingestion to decision-making.
Who We Are
Wet Dog Weather helps teams ingest, transform, and deliver weather and sensor data for modern applications. We provide high-quality datasets and fast, flexible tools to query, process, and visualize the data so it is ready to use wherever needed. We focus on doing one thing exceptionally well: making weather data fast, flexible, and easy to work with at scale.
Our platform powers trusted products, including Carrot Weather, TruWeather Solutions’ V360, Flash Weather AI, and Element Weather, and supports industry standards such as WMTS and WMS for seamless integration with existing systems.

Industries
Automotive
Aviation
Consumer
Utilities


Have a project in mind?
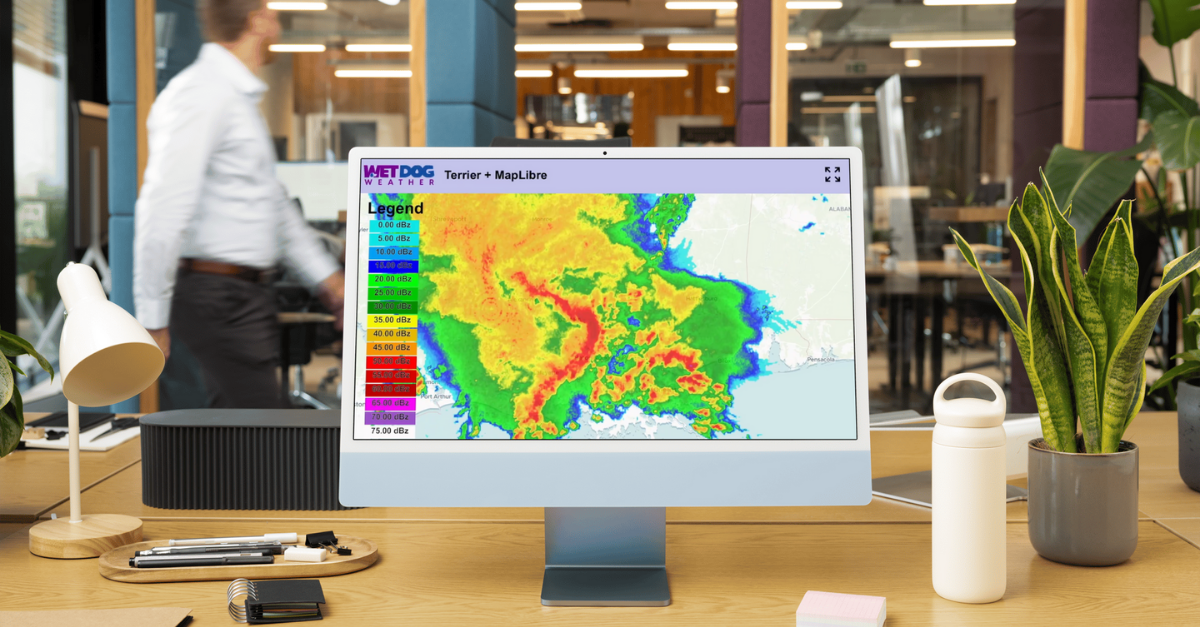
Our weather data platform handles everything from standard datasets to custom data, whether purchased or generated in-house. Customers can have their own Boxer stack with access to Terrier front-end tools, and we provide full support for processing, transforming, and delivering weather information efficiently. Customization is where our expertise shines, helping you get exactly the weather insights you need. Let’s work together to bring your next weather data project to life!
Latest Articles
Building Without Breaking
Previous Posts Week 5: Correct Integration Saves Time Week 4: Data Integration Is More Complex Than It Looks Week 3: Turning Data Into Decisions Week 2: Making Data Actionable Week 1: Building Knowledge Before Making Changes GoalMy goal for the week was to keep...
One Task at a Time
Previous Posts Week 5: Building on a Strong Foundation Week 4: Choosing a Clear Direction Week 3: Designing for Different Users Week 2: Organization Improves AI Results Week 1: The Importance of Staying Organized Goal Continue building on my aviation dashboard...
Specificity Is Key
Previous Posts Week 5: Overcoming Setup Challenges Week 4: Start With The Big Picture Week 3: Designing Around User Needs Week 2: Seeking Advice Leads to Success Week 1: Staying Productive Through Roadblocks Goal Plot Fishing Index variables on the map using Terrier...