Energy trading depends on anticipating change, and few variables drive change more than the weather. From freezing cold snaps to sweltering heatwaves, weather shifts profoundly affect both energy production and demand. That’s why weather visualization for energy trading has become essential. It’s not just about knowing the forecast. It’s about seeing its market impact clearly, both geographically and in real time.
At Wet Dog Weather, we help energy traders go beyond traditional forecasts by turning raw data into highly responsive, embeddable visual tools. We draw from both public and proprietary sources to help you understand not just what the weather is doing, but also how it’s shaping energy supply, logistics, and demand minute by minute.
Why Weather Still Rules the Energy Markets
Weather is deeply intertwined with both the production and consumption of energy. Traders track it constantly, not just to predict prices but to understand the infrastructure at risk, the supply volumes affected, and the load shifts driven by human behavior.
Temperature extremes drive significant swings in electricity demand, especially through heating and cooling systems. Metrics like Heating Degree Days (HDD) and Cooling Degree Days (CDD) give a baseline, but they only tell part of the story. Cold air masses or prolonged heat events affect different regions differently, depending on how energy-intensive their response is. A 95-degree day in New York City hits the grid differently than the same temperature in Dallas.
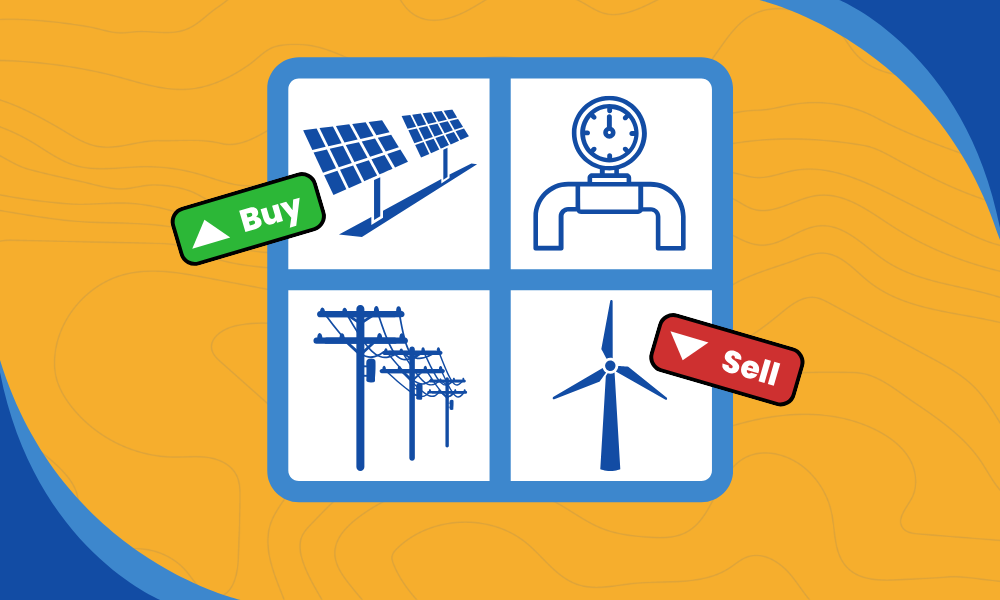
For renewables, weather isn’t a background factor—it is the driver. Wind speed directly influences turbine output, solar irradiance controls panel performance, and rainfall governs hydroelectric generation. A calm, cloudy day in the wrong location can result in a sharp production drop, while a windy week could flood the market with excess electricity. These swings often occur faster than supply can adjust, and that volatility creates opportunity if you can see it coming.
Weather also interrupts logistics. Hurricanes in the Gulf can shut down offshore rigs and ports. Ice and snow can delay fuel shipments by rail or barge. Even wind conditions can interfere with tanker operations. These weather-related disruptions affect transportation timelines, inventory levels, and, ultimately, price behavior. Traders who can anticipate or even just see these risks more clearly are better positioned to make the right call.
Weather Visualization for Energy Trading: The Missing Link
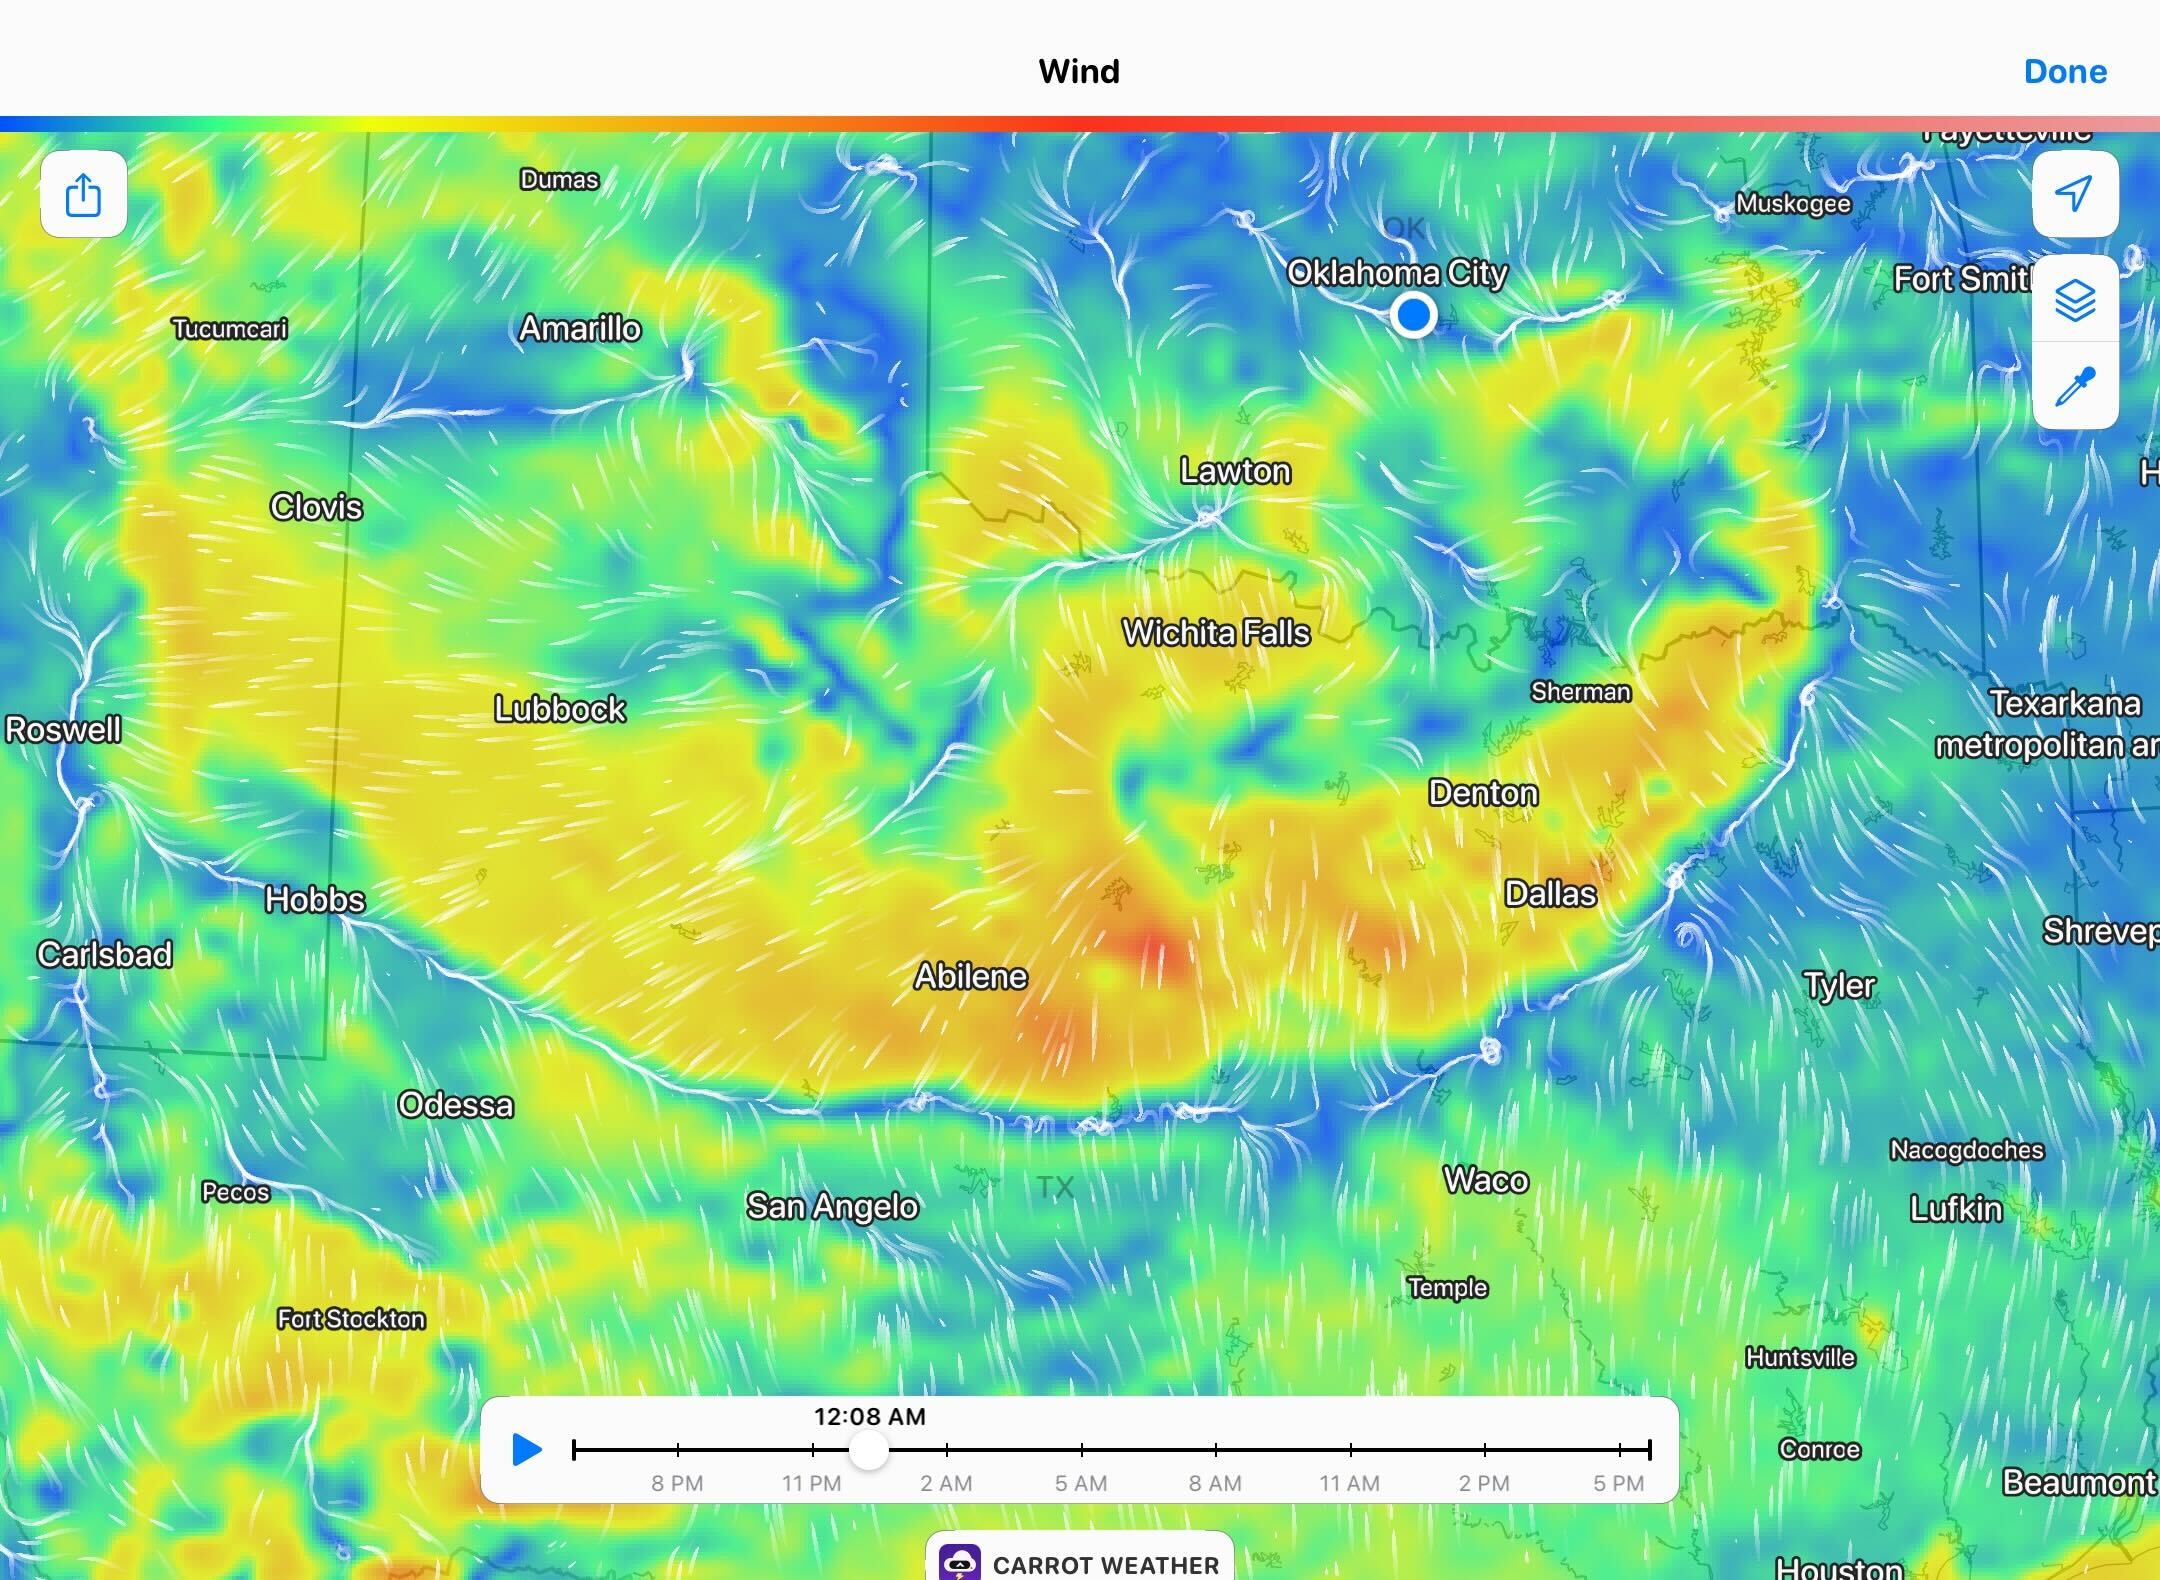
Forecast models are powerful, but in isolation, they’re not always fast enough to interpret. That’s where weather visualization for energy trading becomes crucial. Seeing a forecast unfold on a real-time, interactive map changes how quickly you react and how confidently you move.
Visual tools bring clarity to chaos. Instead of parsing text forecasts or spreadsheets, traders can watch fronts advance, temperature anomalies develop, and radar layers animate in real time. This visual context enables you to assess threat levels, time your trades, and understand the evolving impacts of the market. For instance, knowing that a cold snap is shifting westward matters more when you can correlate that shift with demand centers, pipeline routes, or renewable installations.
High-quality visualization helps identify not only the obvious threats but also subtler anomalies, repeating patterns, or conditions that are out of season but are rising in frequency. Spotting these outliers quickly is the difference between reacting to the market and staying ahead of it.
Better Decisions Start With Better Context
The best results come when traders combine high-resolution forecasts with dynamic visualization. Forecasts provide lead time; visualization brings spatial awareness and immediacy. Together, they create a holistic view that supports better trading strategies.

This integrated approach allows you to simulate potential outcomes, test scenarios against current weather models, and apply insights. For example, a model showing higher-than-average wind across the Midwest isn’t just an input. It’s a signal about likely production increases, transmission loads, and possible pricing dips across regional markets. That’s actionable data if you can see it.
Wet Dog Weather helps traders integrate this context into their workflow. Our visuals are designed to integrate seamlessly within your existing platforms, providing immediate access to the variables that matter most. Whether you’re tracking solar irradiance, atmospheric pressure, radar mosaics, or satellite imagery, our tools make it easy to get the complete picture and act on it.
Seeing the Market Differently
Ultimately, energy trading is about understanding risk and acting decisively. With renewables on the rise and weather patterns becoming more erratic, that job only gets harder. However, with high-quality forecasting and weather visualization for energy trading, it becomes more manageable and profitable.
The difference between reacting to the market and anticipating it often comes down to one thing: how clearly you can see what’s coming. With Wet Dog Weather, that clarity becomes part of your toolkit.

