Air quality data isn’t quite the same as weather, but it’s similar. It covers the same areas, it’s structured in the same way, and it’s something that weather users often want to see. That’s why we now support air quality data alongside our standard weather products.
EPA Air Quality Data from AirNow
The Environmental Protection Agency (EPA) provides air quality data from its sensors, which cover much of the US. They also offer a forecast for the upcoming day.
Here’s what the current conditions look like on their AirNow map.
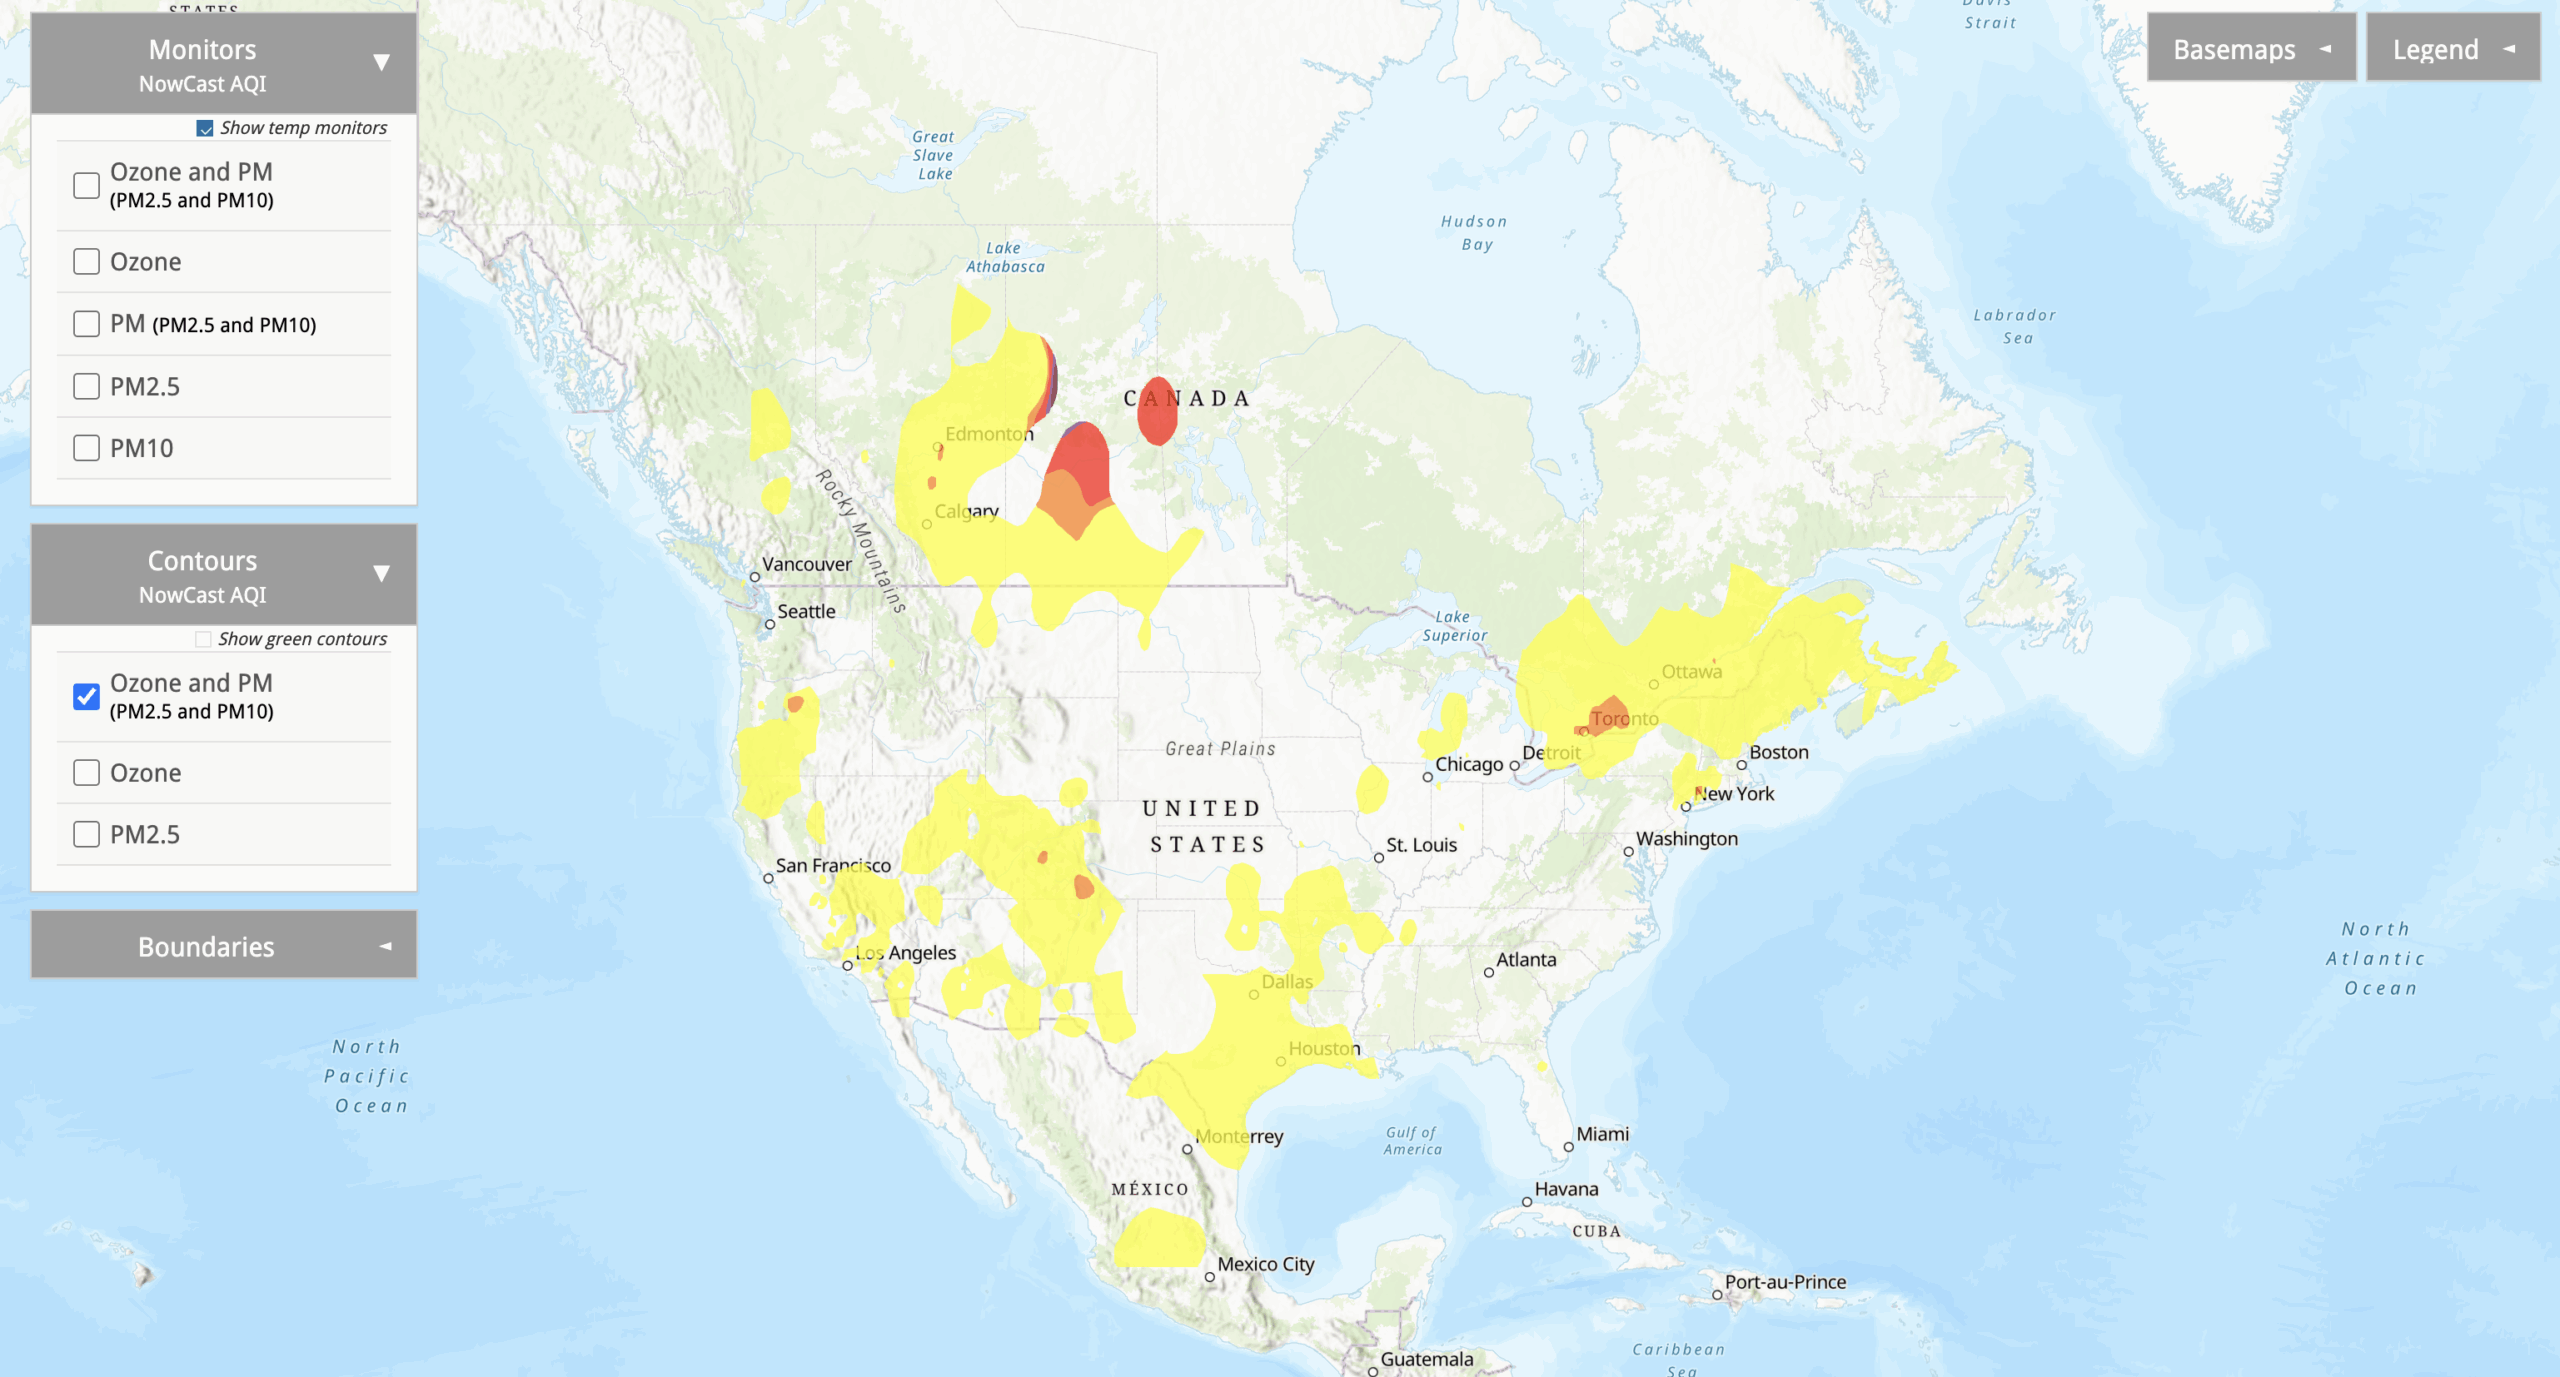
We have customers who want that data for their own purposes, and we now provide it for both display and query.
AirNow Data in Terrier
Here is the observational data for PM2.5 from the EPA sensors.
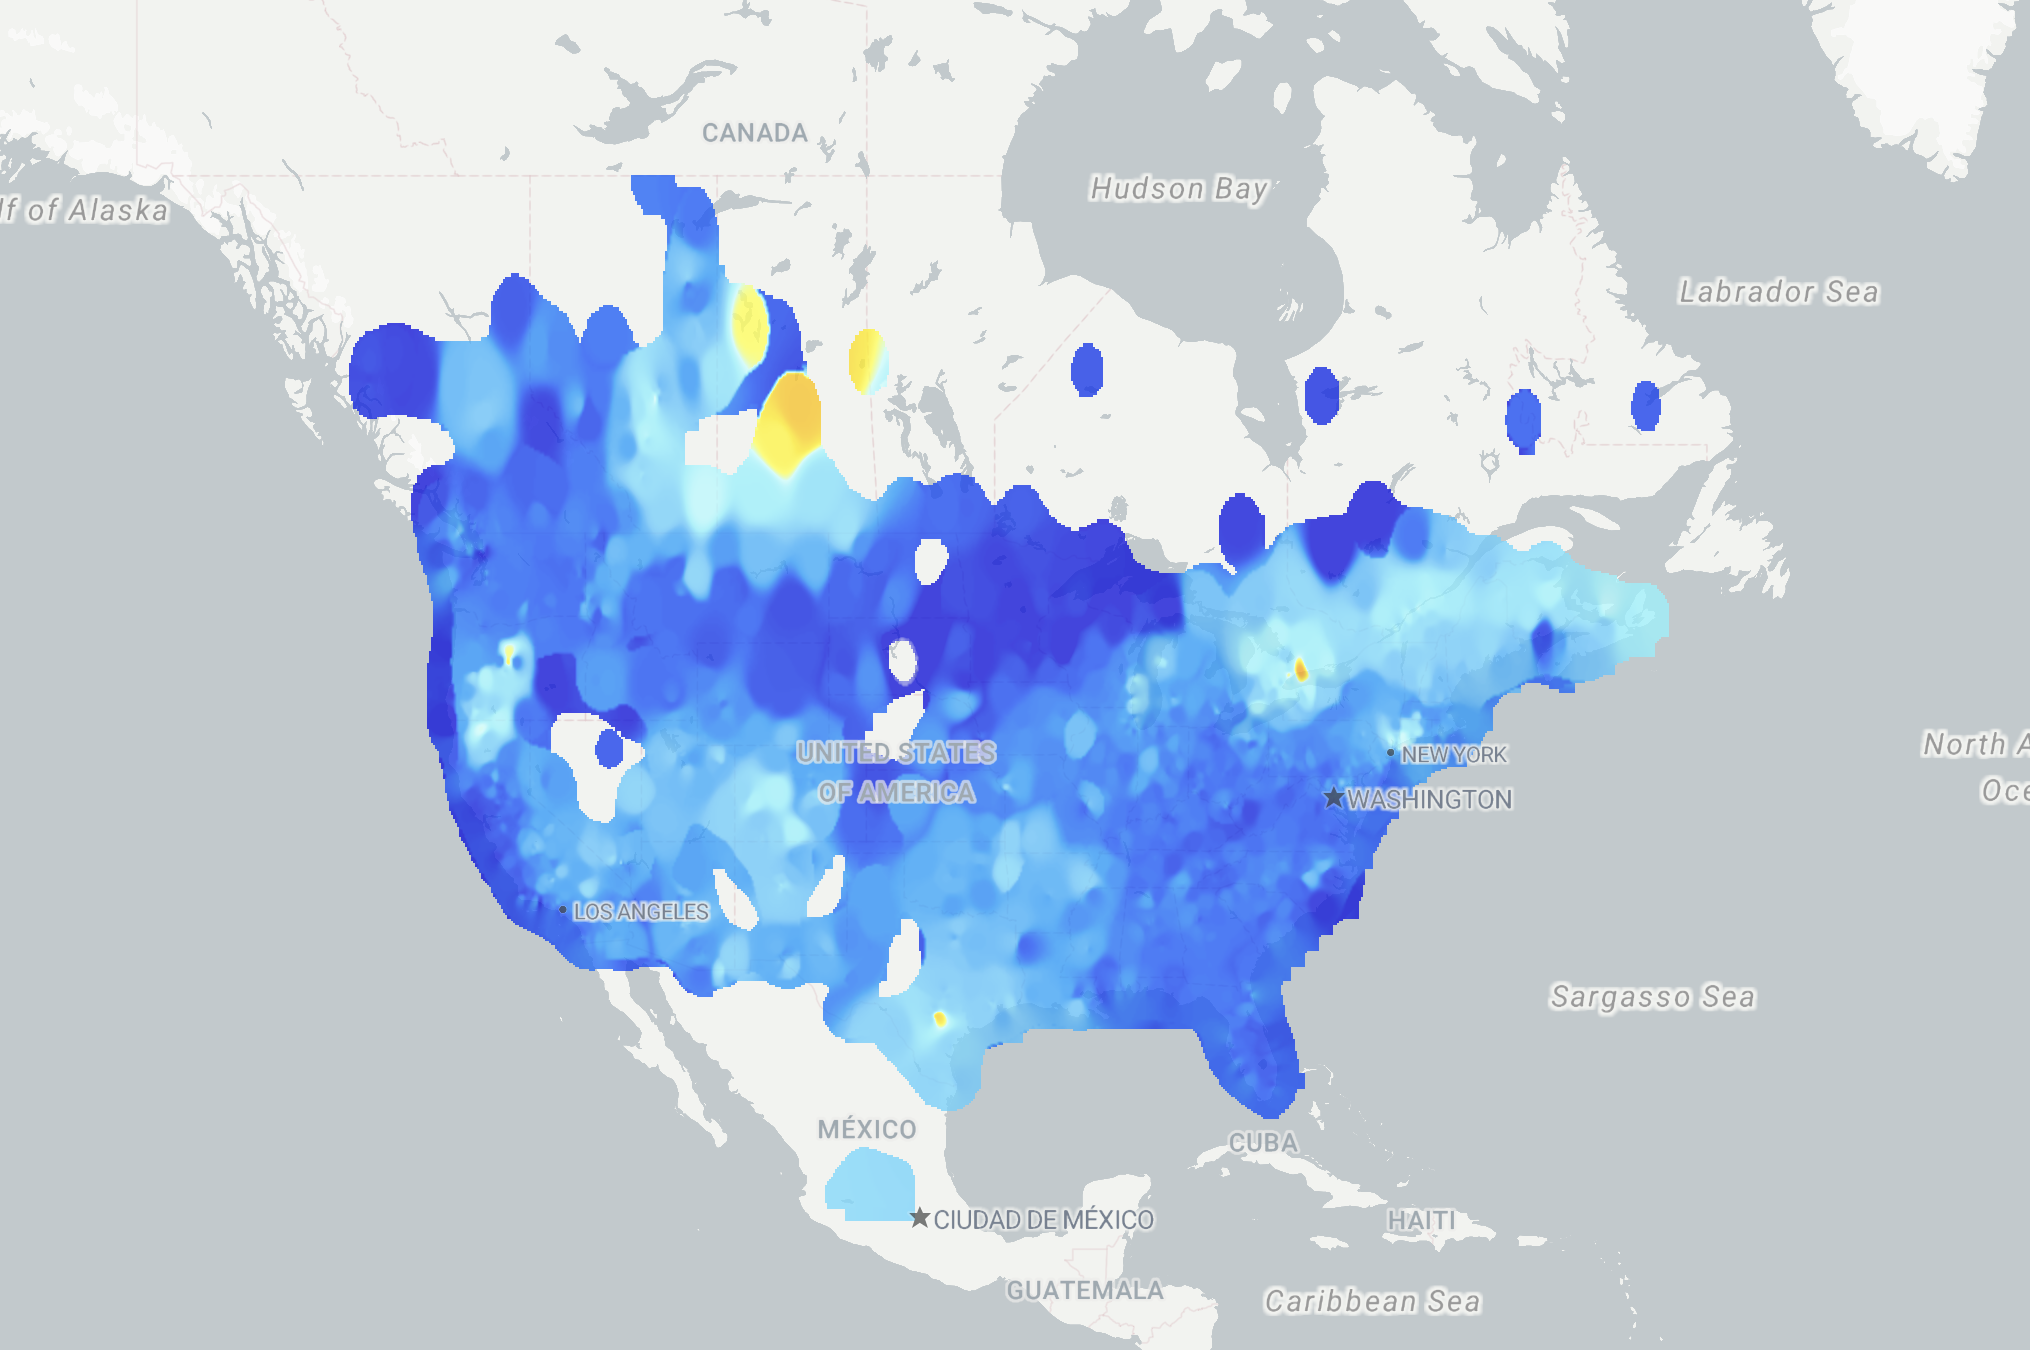
The colormap isn’t standard, but it looks cool. If you want to create your own colormap, you can do so in Terrier.
We provide PM10 and PM2 particulate observation grids as well as a combined version. Those lag the current time by an hour or two and are provided hourly. It’s a straightforward way to incorporate air quality data into your visuals or internal tools.
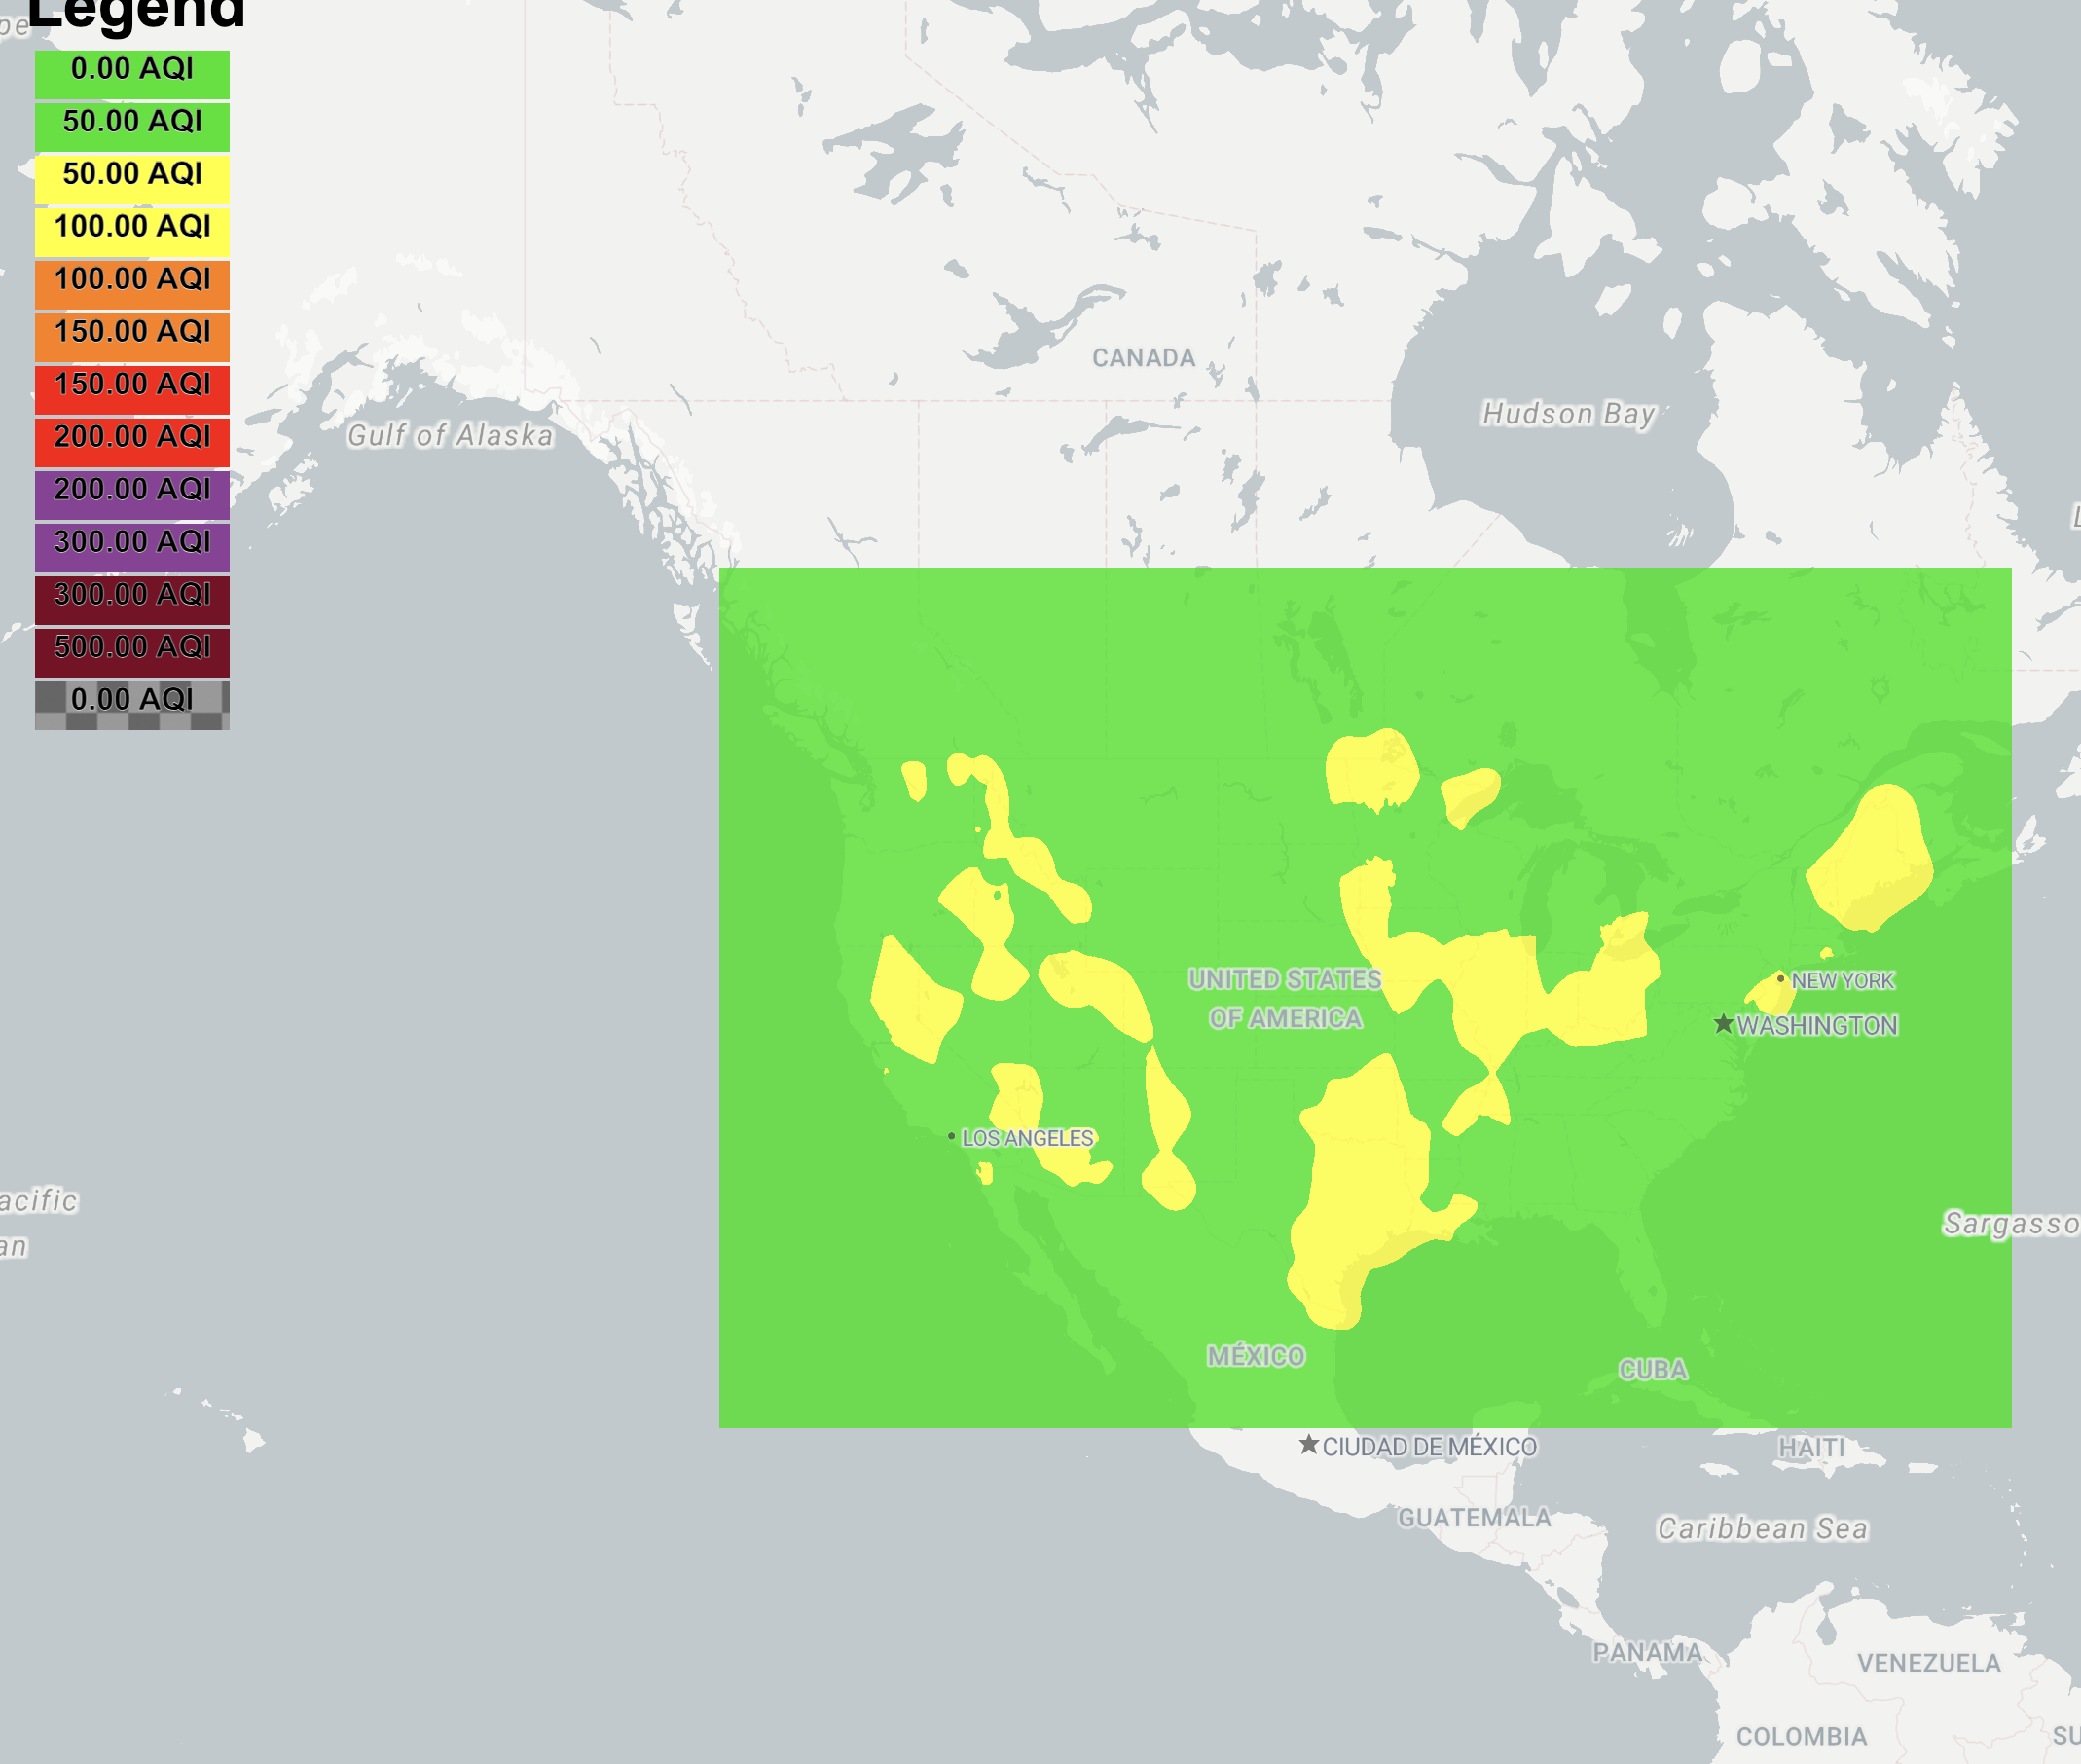
We also provide the Air Quality Index data for today and tomorrow, when it first appears. Although that is much less fun to look at.
Interested in Air Quality Data?
These are some of our least complex data sets, though the data scraping was a little tricky behind the scenes.
If you’re looking for clean, structured air quality data to layer into your weather tools, we’re already on it—and happy to add more. Let us know what you need.
