Since we got Boxer up and running a few years ago, we’ve steadily added data sets. Most of these are proprietary, but we have several new Boxer weather data layers available in our public datasets. Let’s examine some notable additions that have recently been made to enhance our visualization capabilities.
Boxer Weather Data Layers: Cloud Cover
Both GFS and HRRR have cloud cover available in our Boxer weather data layers. Cloud cover is measured as a percentage, and the higher the percentage, the less sun there is. Depending on your skincare regimen, that can be good or bad.
Total Cloud Cover is measured from the Earth’s surface up to space, more or less. At a certain point, there’s nothing much up there, but you get the idea.
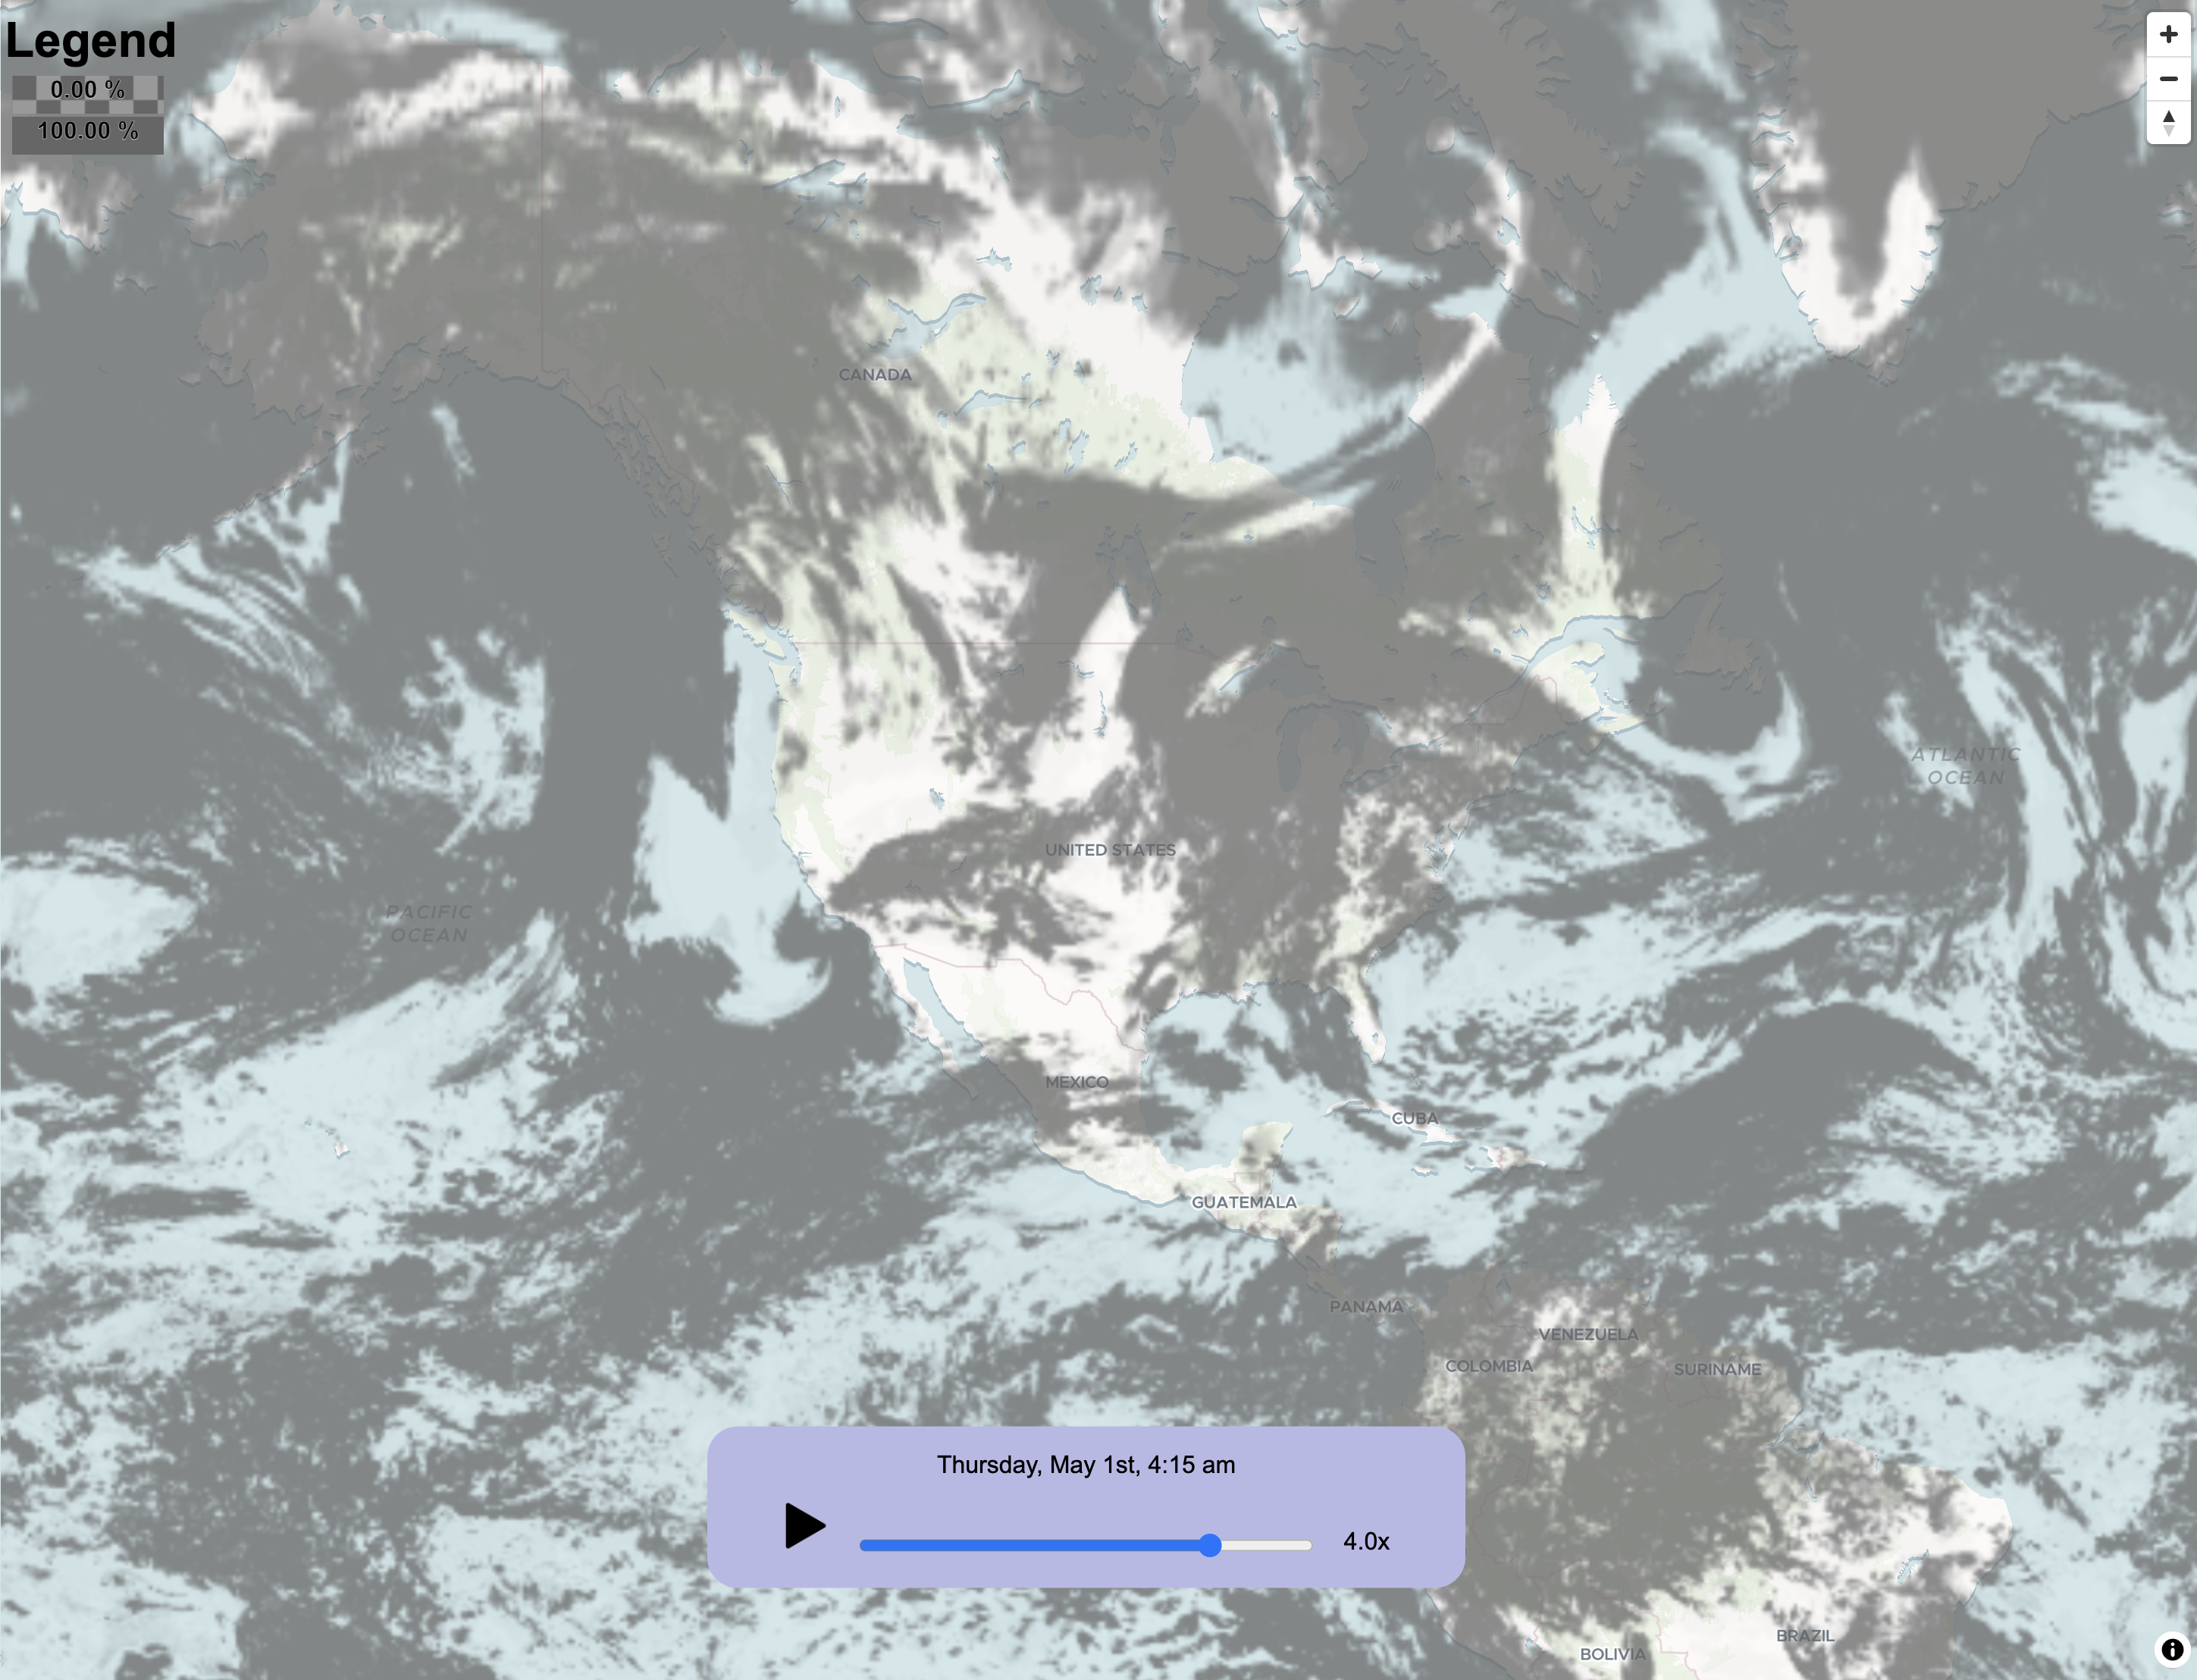
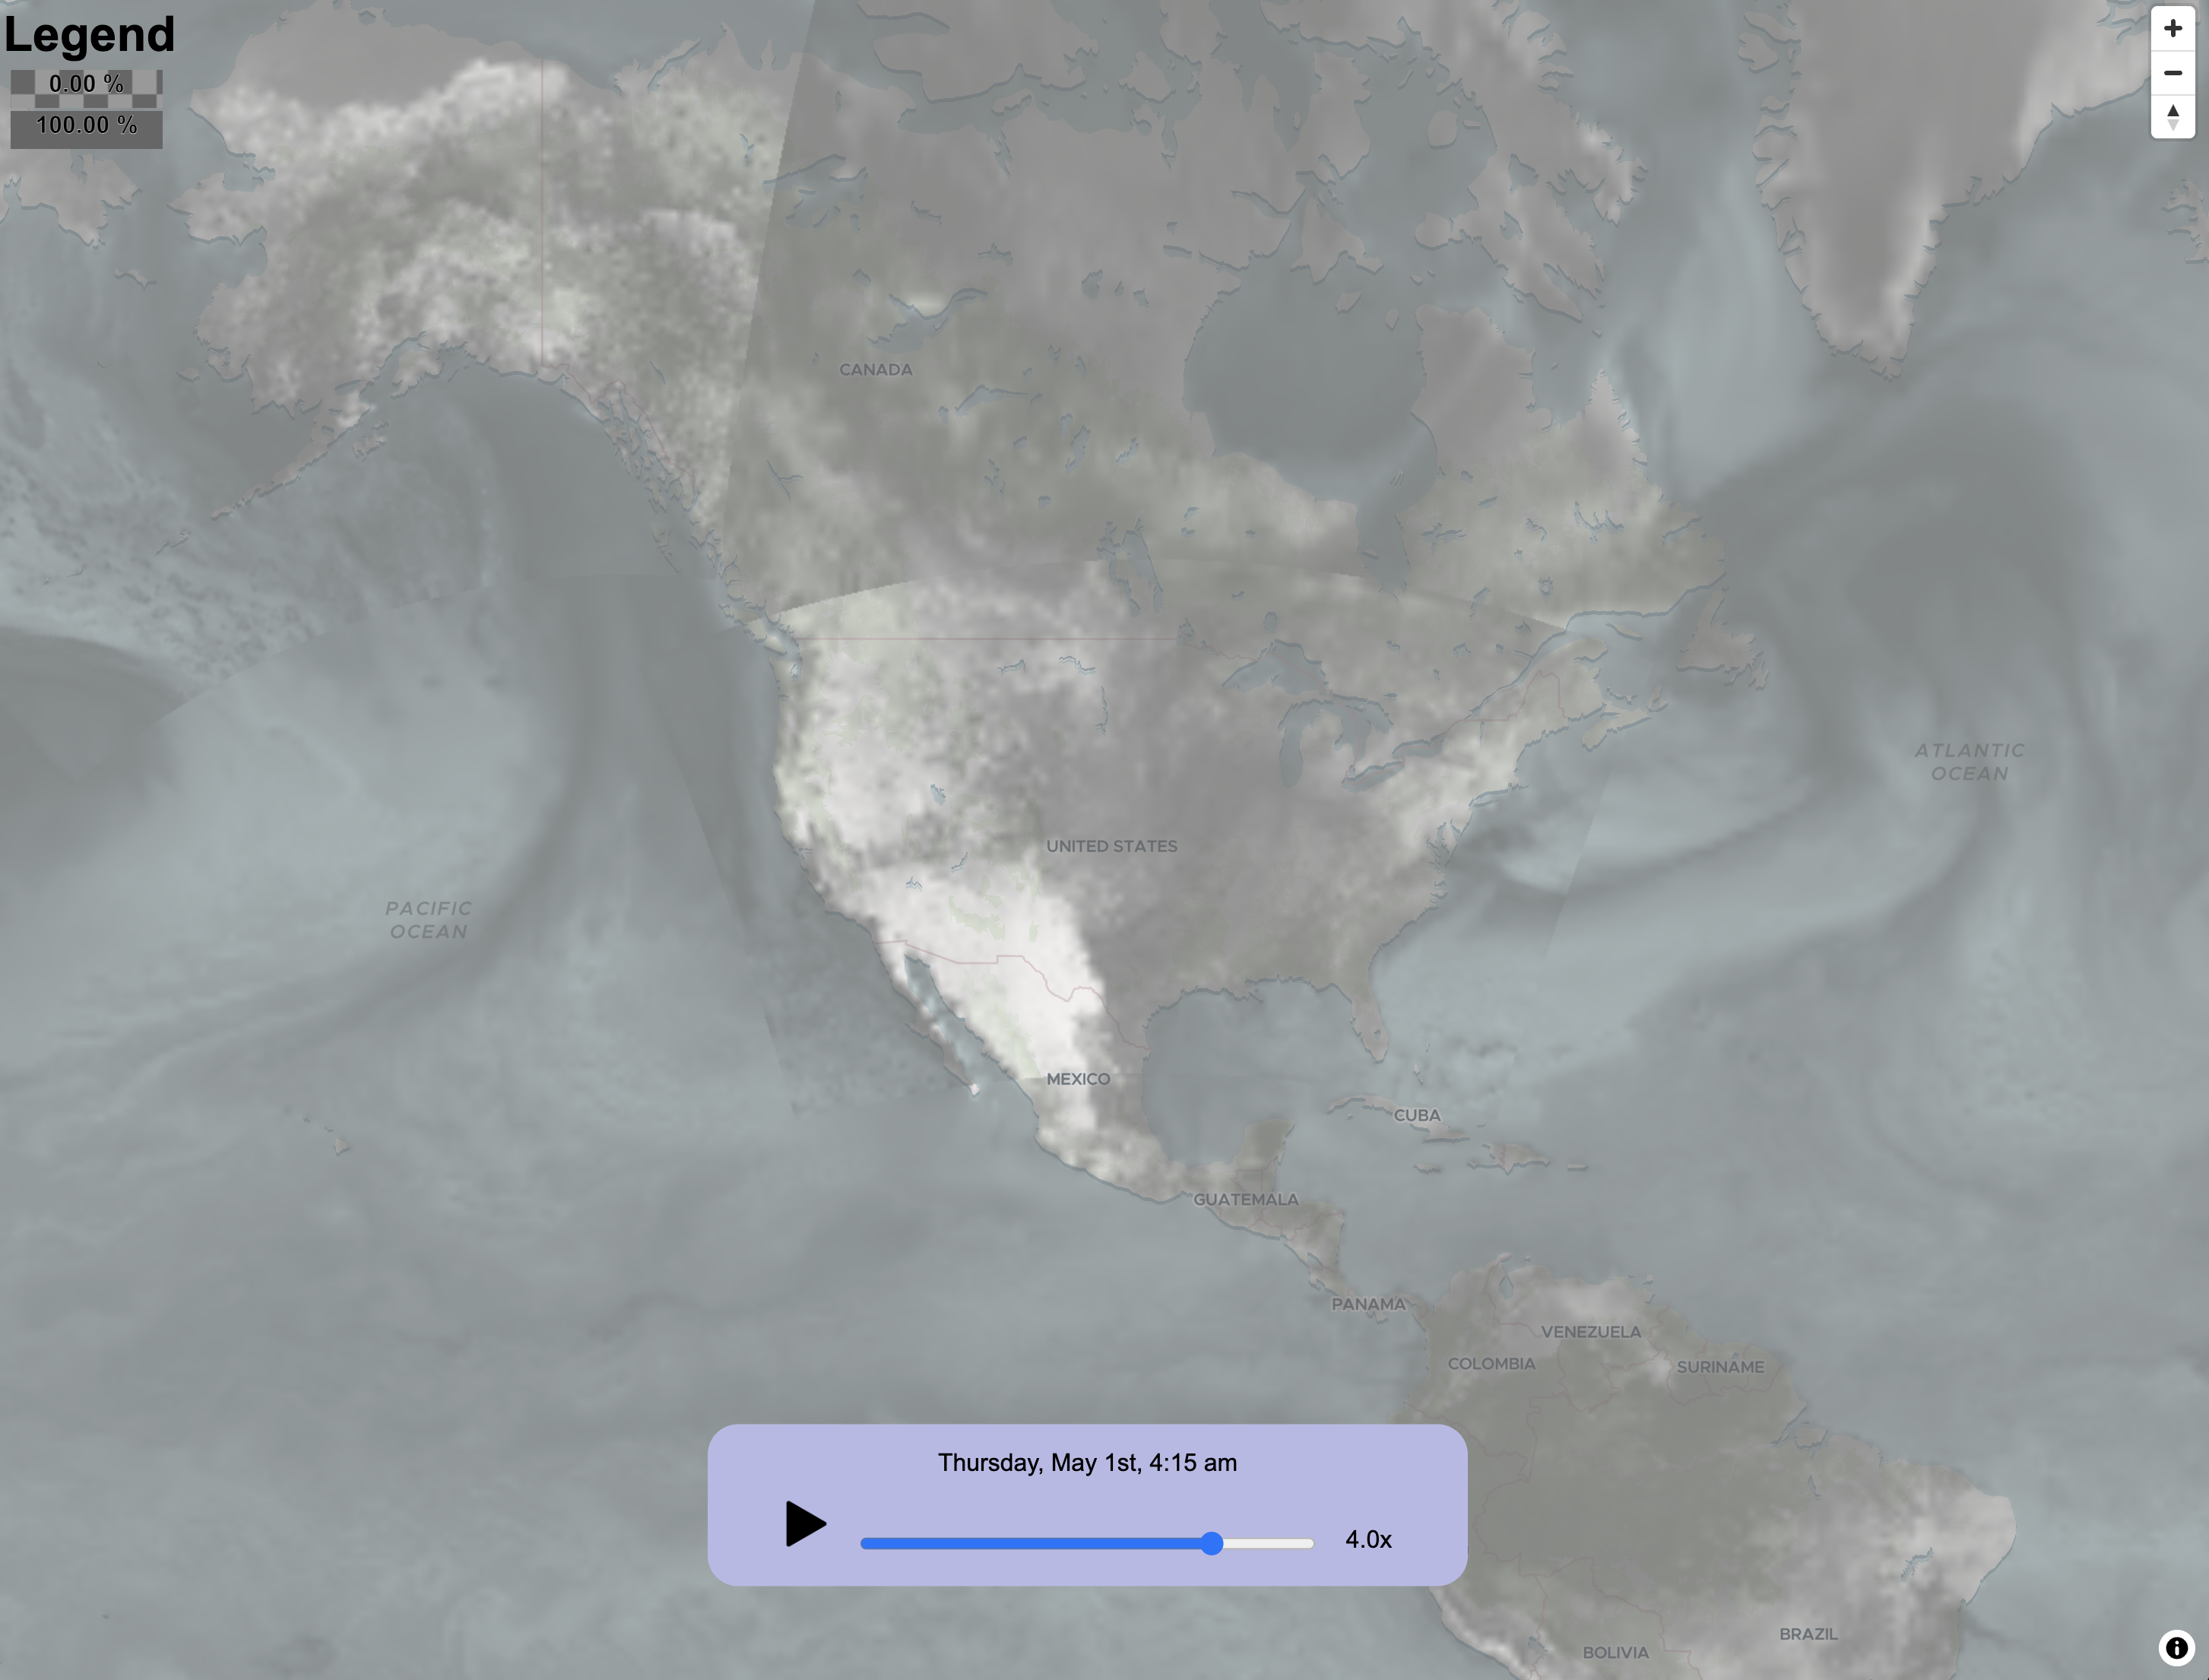
HRRR and GFS will break cloud cover into low, medium, and high buckets. It would be cool for a weather app to utilize this information. It could be displayed as medium with the high shadowed on top of the low to indicate height. Here’s Low Cloud Cover, one of our more visually interesting Boxer weather data layers.
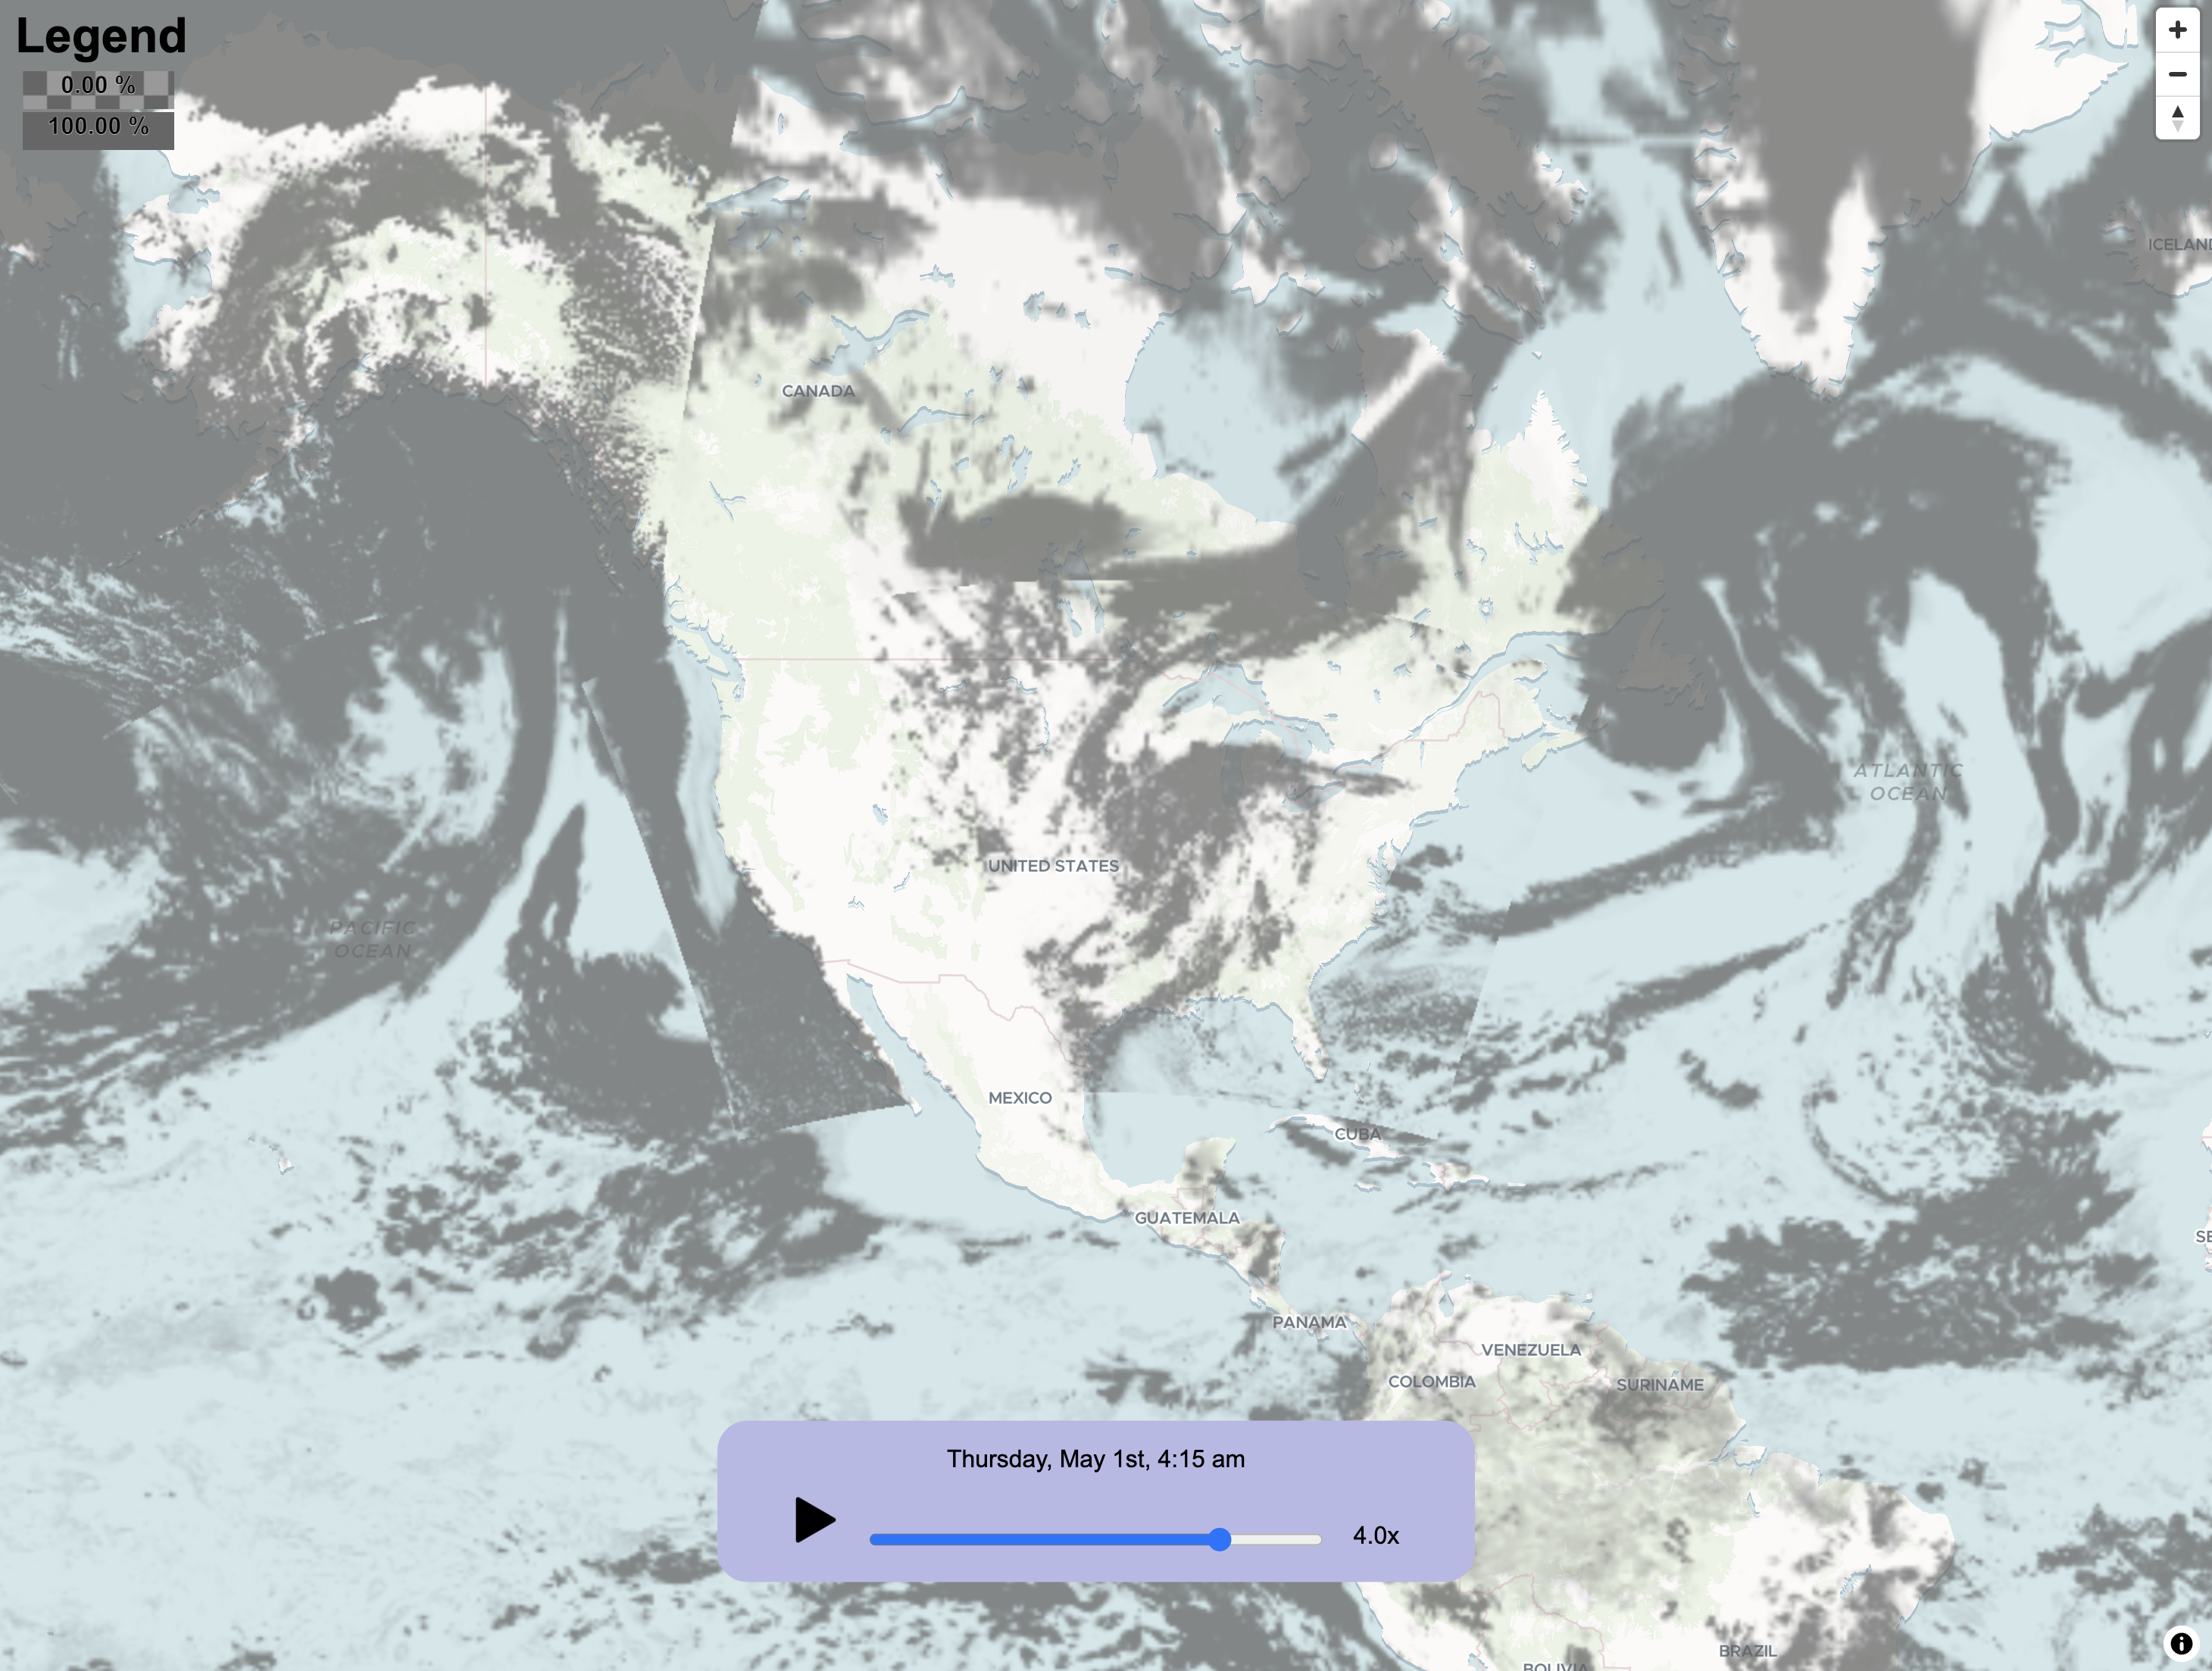
I really wish someone would captured the marine layer in San Francisco. No one does fog to my satisfaction.
Boxer Weather Data Layers: Visibility
Speaking of cloud cover, here’s visibility. That’s how far you can see from a given point. Our colormap for this Boxer weather data layer is a bit ugly, but you get the general idea.

Boxer Weather Data Layers: Composite Reflectivity
Both HRRR and GFS have a composite reflectivity you can use to compare against radar reflectivity. There’s a formula… and either you understand it better than I do, or you’re not that interested. Suffice it to say, you get a radar-like effect by doing a little math.
Here’s the HRRR reflectivity calculation from April 30. Looks cool and represents one of our more technical Boxer weather data layers.
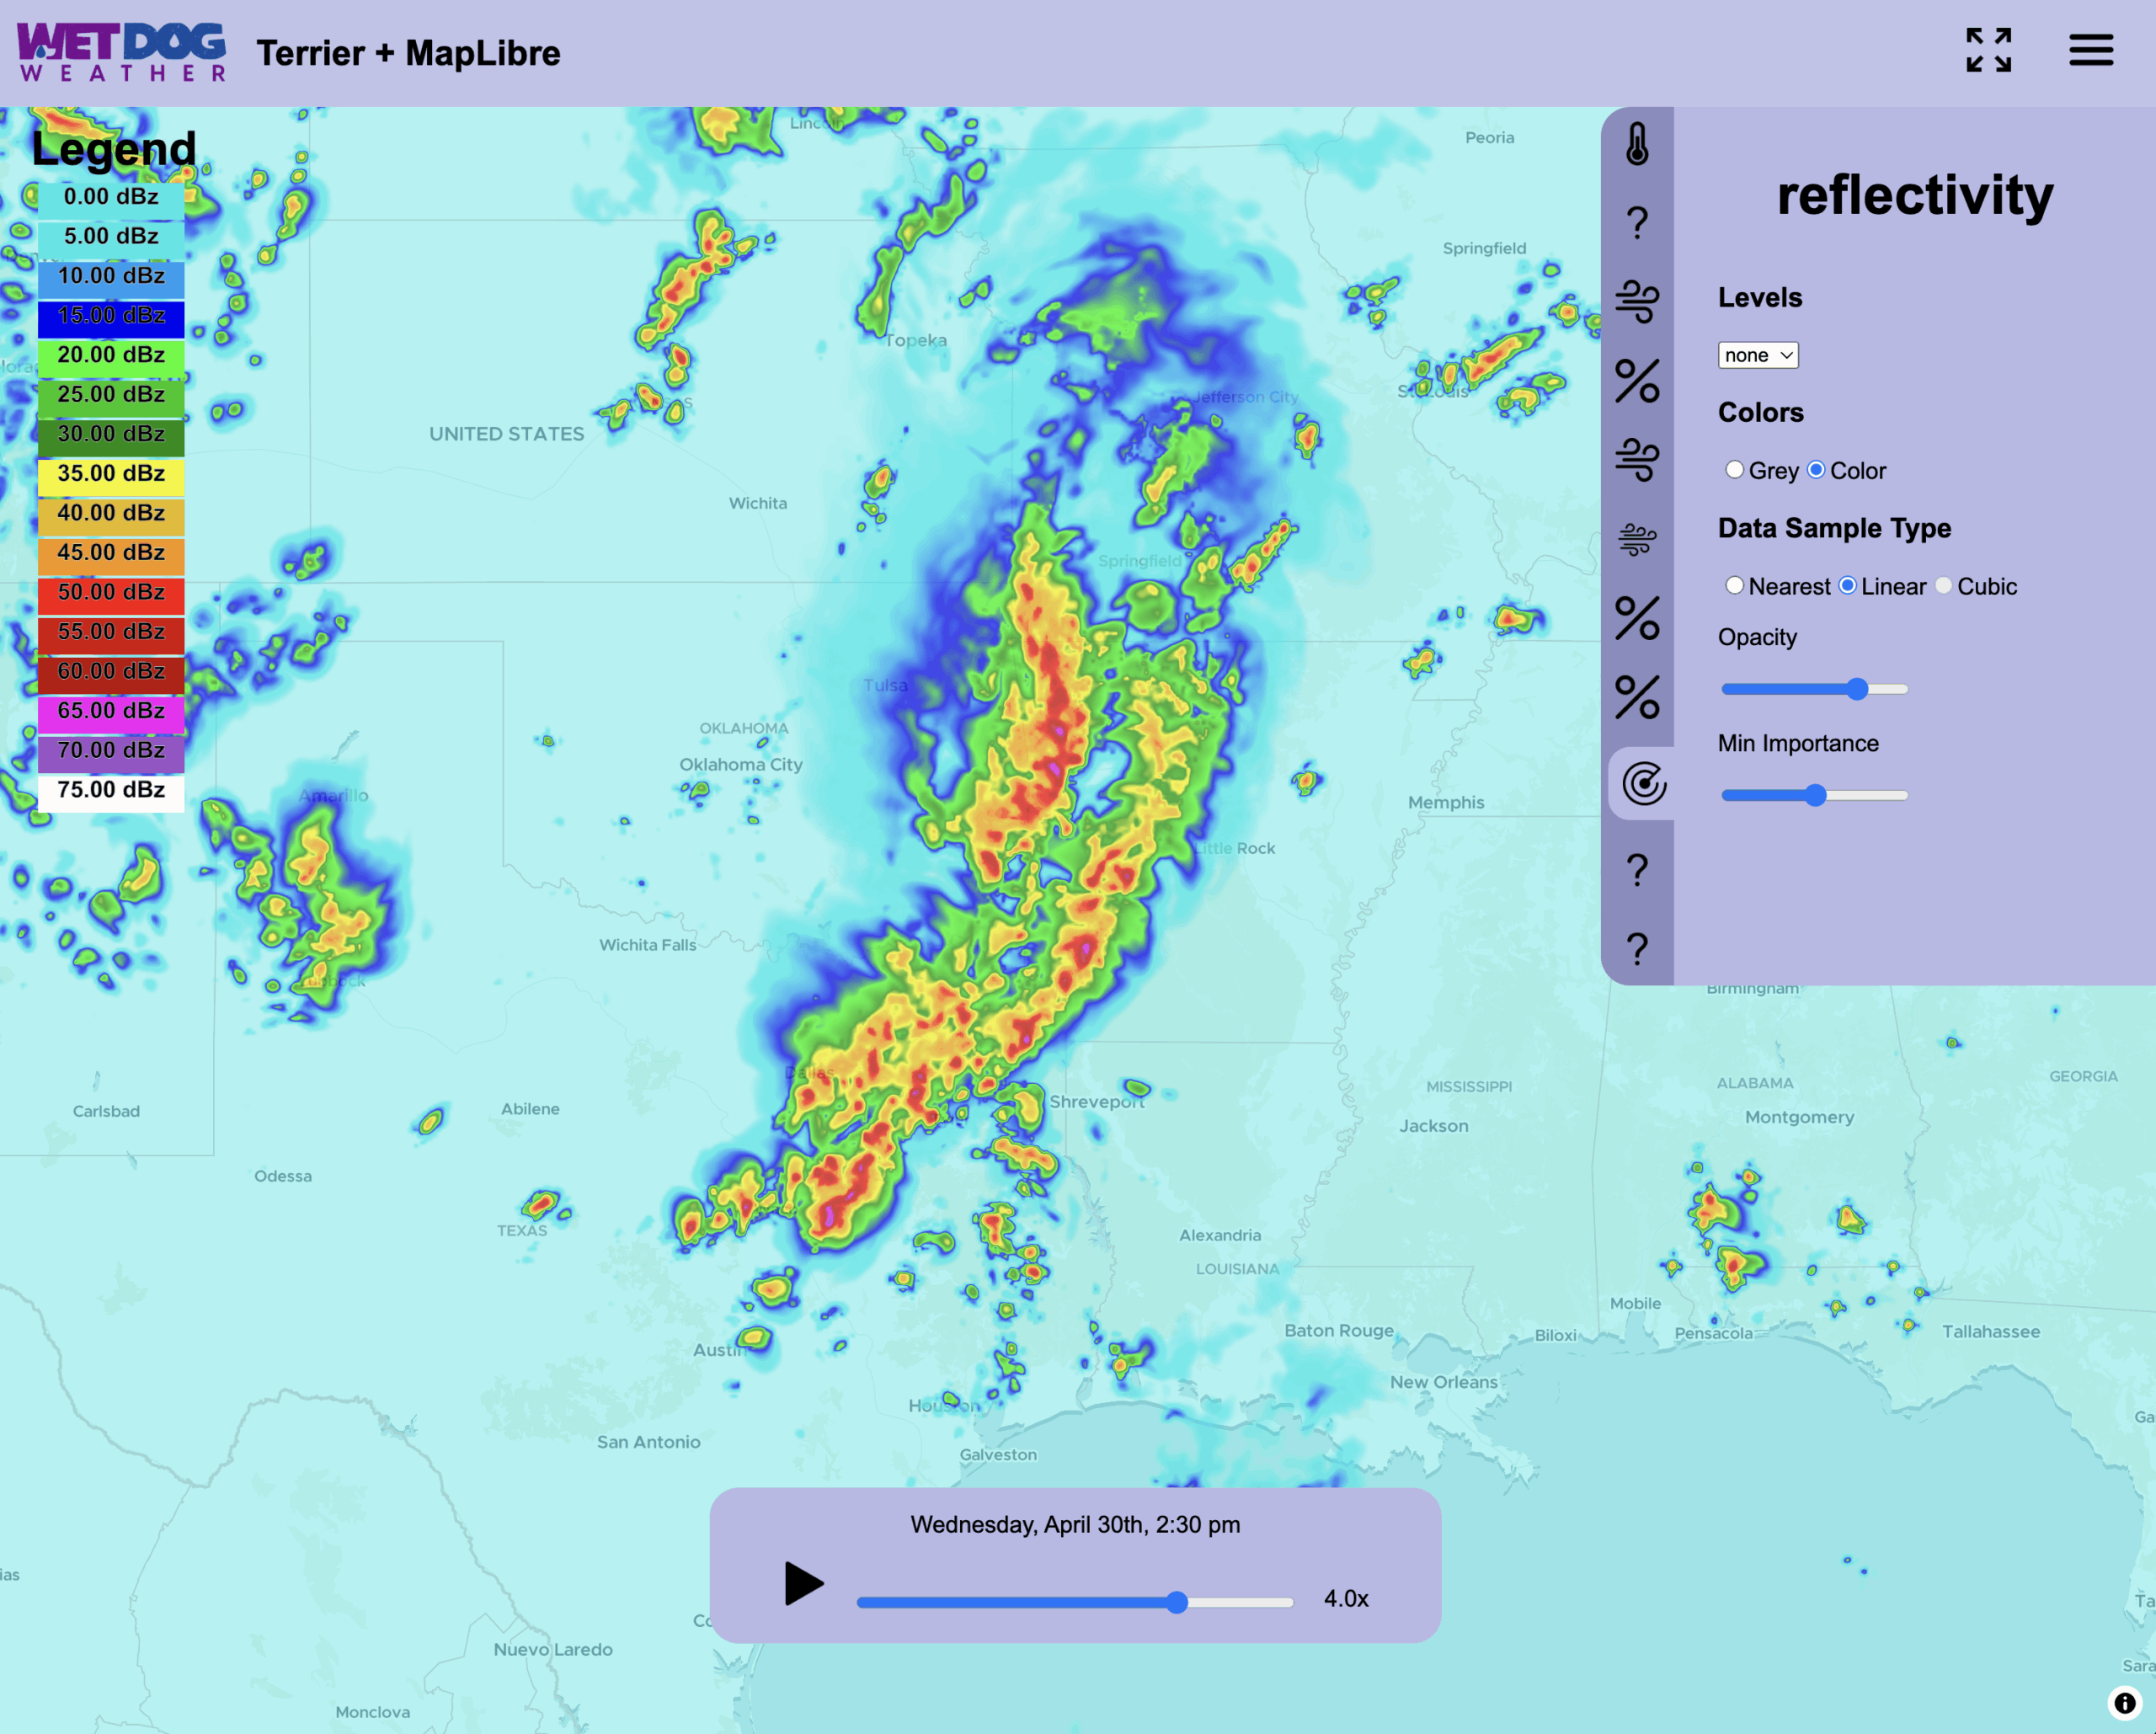
It’s a good day for weather but a bad day to be in weather. Let’s see how that HRRR compares to the Multi-Radar Multi-System mosaic from the NWS.
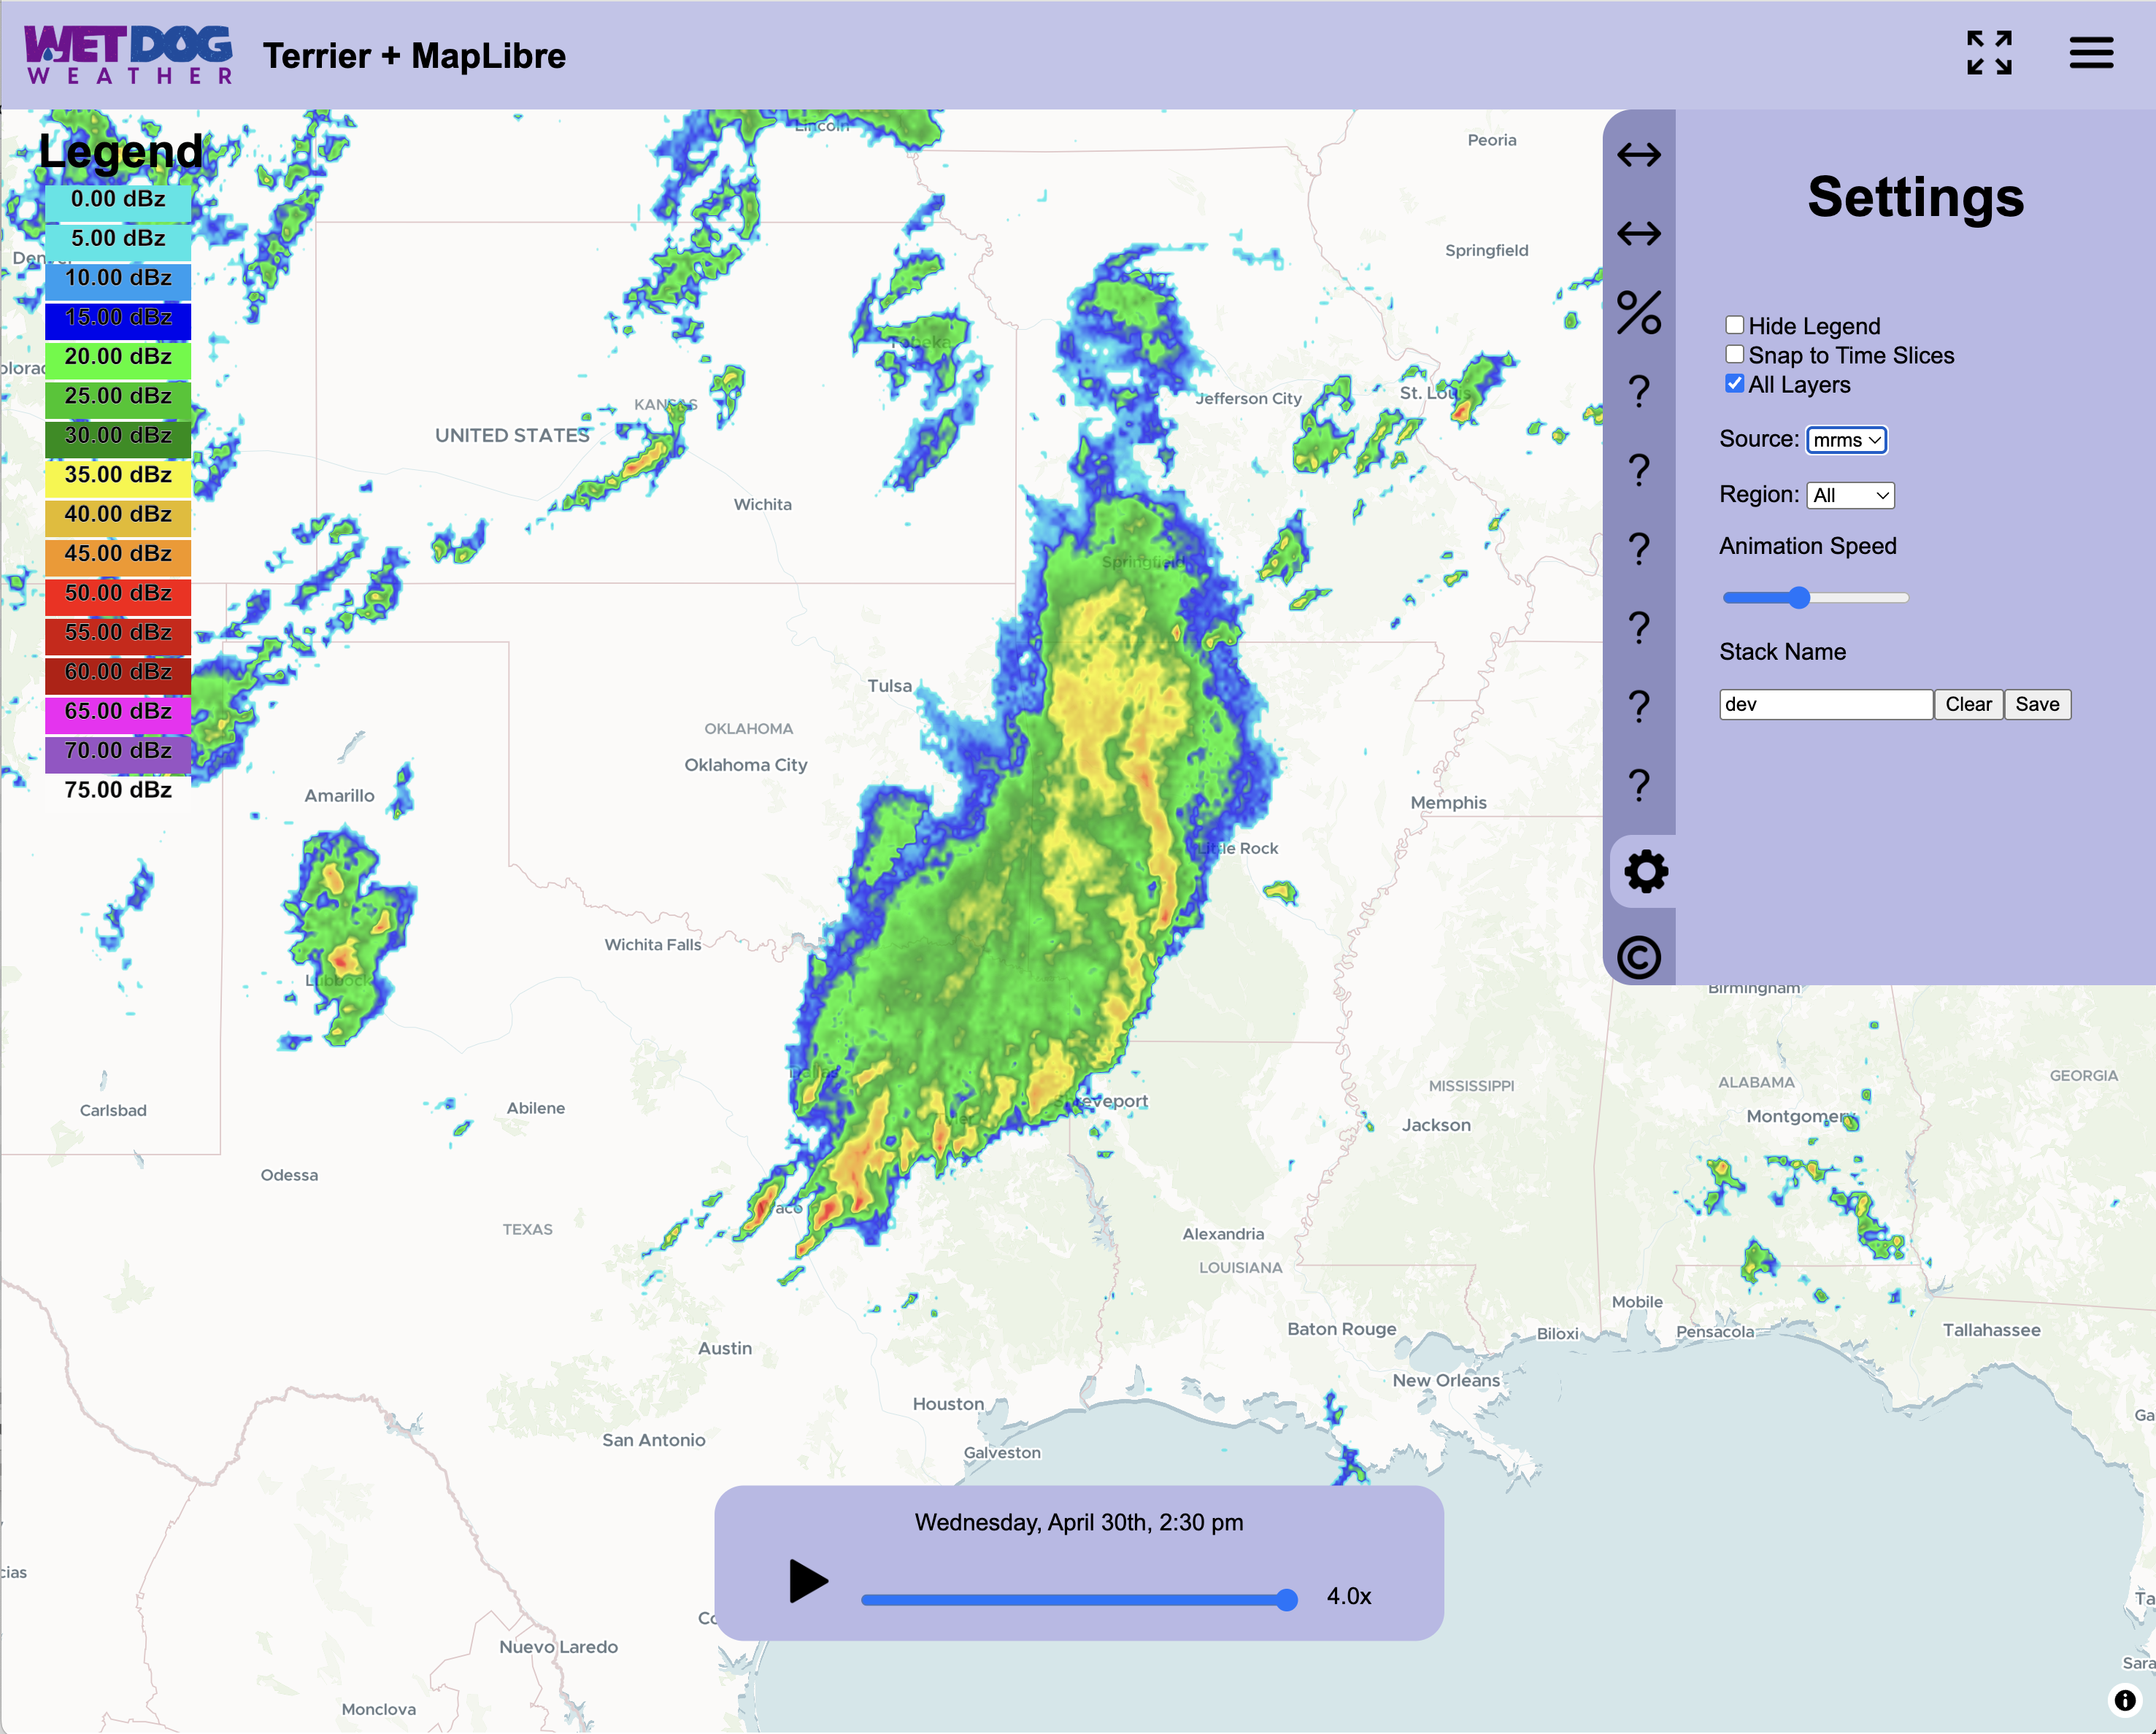
Not bad from a meteorological perspective.
Additional Data Layers
We now process endless layers that don’t look very interesting. How many levels of wind do you need? Most of them? I’ll save you the suspense. They get stronger the higher up you go.
Relative humidity is one of the more useful but boring Boxer weather data layers. I’m selling it a bit short; it has some visual appeal.
What’s Next
Those are a few of the new layers we’ve added to our Boxer weather data collection. We’re continually expanding our offerings as our customers request them, and there are a bunch of exciting new layers in the pipeline. Whether you need specialized atmospheric data or general weather patterns, our growing suite of visualization tools has you covered.
